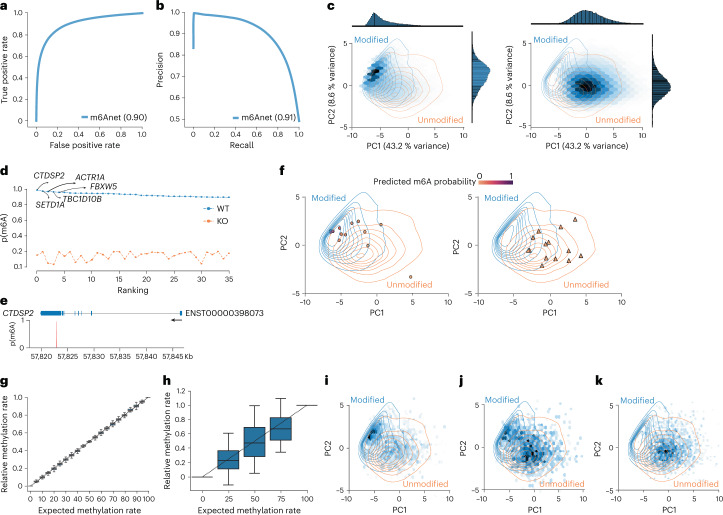
Fig. 4. Quantification of m6Anet on HEK293T cell line.
a,b, ROC curve (a) and PR curve (b) of m6Anet single-molecule prediction on IVT and synthesized RNA reads from curlcake datasets. c, Hex plot of the top four modified fivemer (GGACT, GAACT, GGACA, AGACT) for the wild-type sample (left) and KO sample (right) with density plot of modified and unmodified samples from curlcakes reads. d, Ranking plot of the positions in c and the genes associated with the top positions. e, Gene plot of the top ranked modified position. f, Scatter plot of randomly sampled reads from the position highlighted in e, on the wild-type cell line (left) and METTL3-KO cell line (right). The colour indicates the read-level m6A probability. g,h, Box plots showing the predicted relative methylation rate on synthetic reads with n = 43 (g) and on the HEK293T cell line with different levels of wild-type and METTL3-KO RNA mixtures with n = 34 (h) (Methods). The horizontal lines on the boxes show minima, 25th percentile, median, 75th percentile, and maxima. Points that do not fall within 1.5× the interquartile range are considered outliers and are not shown on the plot. i–k, Hex plots of the read-level feature map for 0% (i), 50% (j), and 100% (k) KO mixtures on filtered positions.

