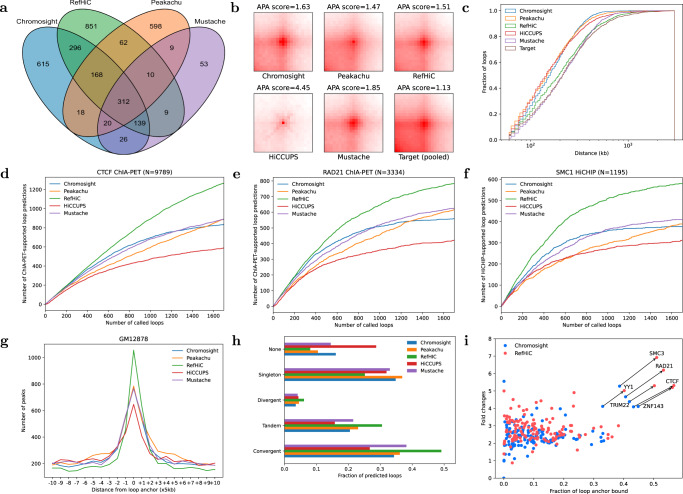
Fig. 2. Comparison of RefHiC, Chromosight, Peakachu, HiCCUPS, and Mustache on GM12878 Hi-C data (500M valid read pairs).
a Venn diagram of loops predicted by different tools. b Aggregate peak analysis profiles for target (ChIA-PET and HiCHIP identified) and annotated loops. c Cumulative distance distributions of predicted loops. RefHiC’s predicted loop distance distribution closely resembles that of ChIA-PET/HiCHIP-supported loops (target). d–f Number of ChIA-PET/HiCHIP-supported loop predictions, among the top 1700 predictions made by RefHiC and other tools, for test chromosomes chr15, chr16, and chr17, compared against CTCF ChIA-PET (d), RAD21 ChIA-PET (e), and SMC1 HiCHIP (f). RefHiC’s loop predictions matches those experimental data better than predictions made by other tools on test chromosomes. g Occupancy of ChIP-seq identified CTCF binding site as a function of distance to predicted loop anchors. h Orientation of CTCF motifs at predicted loops. i Transcription factor (TF) occupancy at predicted loops (RefHiC and Chromosight only). Each dot is a TF or histone modification (based on 133 ENCODE ChIP-seq data sets for GM12878), whose x-coordinate is the fraction of loop anchors containing a binding/modification site and the y-axis is the fold enrichment against genome-wide frequency. Most TFs are more strongly enriched at RefHiC loop predictions than at Chromosight loop predictions.

