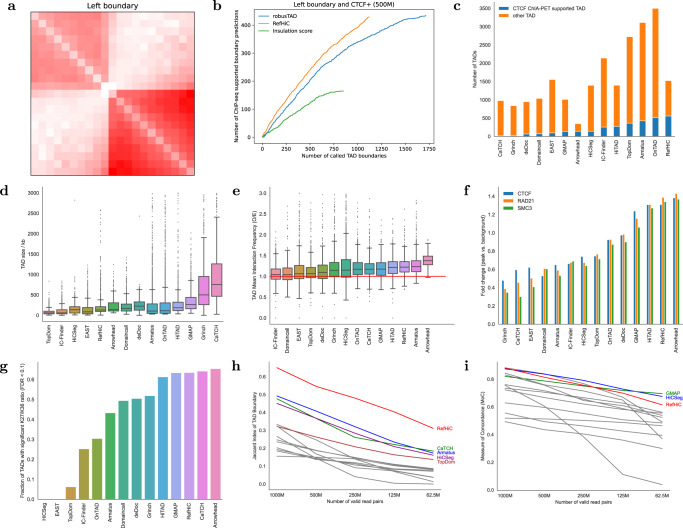
Fig. 6. Detection of TAD boundaries and TADs on GM12878 Hi-C data.
a TAD boundary pileups for left boundaries predicted by RefHiC. b Number of predicted left TAD boundaries supported by ChIP-seq identified CTCF binding sites (positive strand only), for RefHiC, RobusTAD, and Insulation score. c–i Benchmarking RefHiC against 13 other TAD callers on TAD annotation. c Number of TADs predicted by different tools, and proportion of predicted TAD boundary pairs that are supported by CTCF ChIA-PET data. Size (d), and mean interaction frequency (observed/expected) (e) of TAD predictions. The number of TADs used to generated box plots are provided in (c). In each box, the upper edge, central line, and lower edge represent the 75th, 50th, and 25th percentile, respectively. Upper whiskers represent 75th percentile + 1.5 × interquartile range (IQR), lower whiskers represent minimum values, and dots represent samples above the 75th percentile + 1.5 × IQR. f Enrichment of CTCF, RAD21, and SMC3 peak signals at TAD boundaries. g Fraction of TADs predicted by each caller with a significant (high or low) H3K27me3/H3K36me3 log10-ratio (FDR < 0.1). Jaccard index of predicted TAD boundaries (h) and Concordance between TADs (i) predicted on high-coverage GM12878 data (2B valid read pairs) compared to those predicted on downsampled Hi-C data. Note: a–g are based on a downsampled GM12878 Hi-C data set that containing 500M valid read pairs).

