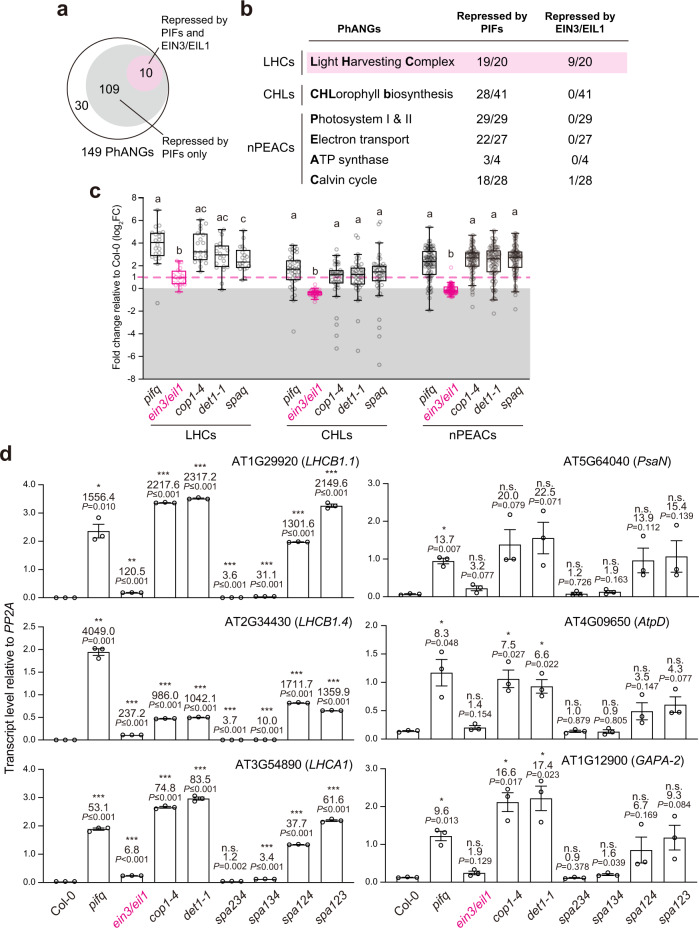
Fig. 2. Only a subset of PhANGs are constitutively activated in ein3/eil1.
a Venn diagram showing PhANGs repressed by PIFs and EIN3/EIL1 in dark-grown seedlings. b Table showing the number of PIF-repressed and EIN3/EIL1-repressed genes in the PhANG subcategories. c Box-and-whisker plots showing the fold changes in LHCs, CHLs, and nPEACs in pifq, ein3/eil1, cop1-4, det1-1, and spaq compared with Col-0 seedlings. Each data point represents a gene; data points above the dotted magenta line are statistically significantly upregulated in the mutants by at least two-fold. The lower and upper bounds of the box represent the 25th and 75th percentile respectively; the center bar represents the median. The lower and upper end of the whiskers represent minimum and maximum values respectively. Dots outside of the whiskers represent outliers based on Tukey’s fences. Different letters denote statistically significant differences in gene expression among the mutants within each subcategory (ANOVA, Tukey’s HSD, P ≤ 0.05; n = 3 biological replicates for pifq, cop1-4, det1-1, and spaq, and n = 2 biological replicates for ein3/eil1). d qRT-PCR analysis of the steady-state transcript levels of representative LHCs (LHCB1.1, LHCB1.4, and LHCA1) and nPEACs (PsaN, AtpD, and GAPA-2) in 4-d-old dark-grown seedlings of Col-0, pifq, ein3/eil1, cop1-4, det1-1, spa234, spa134, spa124, and spa123. The transcript levels were calculated relative to those of PP2A. The fold changes between the transcript levels in the mutants and Col-0 are shown. Asterisks indicate statistically significant differences between the transcript levels of the mutant and Col-0 based on two-tailed Student’s t-test (*P ≤ 0.05, **P ≤ 0.01, ***P ≤ 0.001). If the change was less than two-fold or not statistically significant, it is labeled as n.s. (not significant). Error bars represent the s.e. of three biological replicates, and the centers of the error bars represent the mean values. The source data underlying the statistical analysis in c and qRT-PCR analysis in d are provided in the Source Data file.

