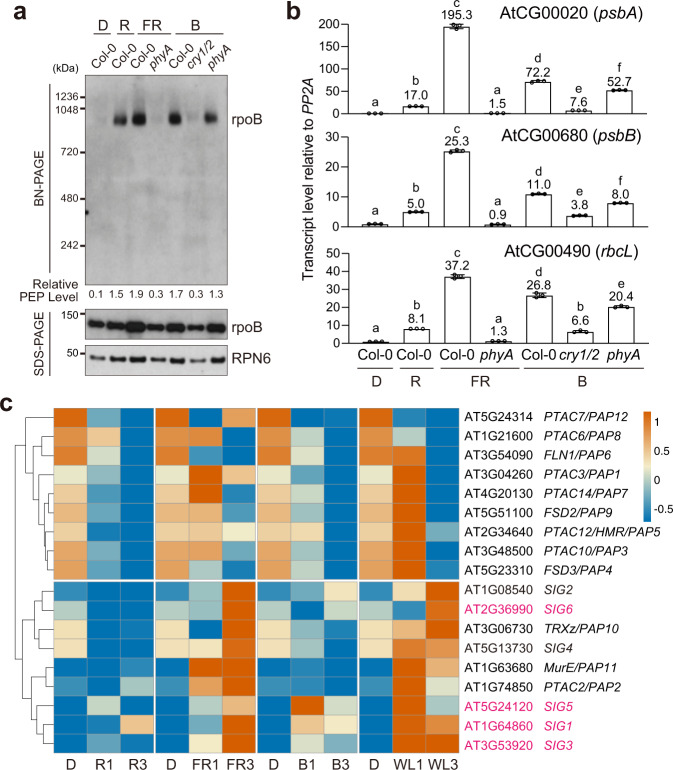
Fig. 8. PIF-repressed sigma factors are rapidly induced by light.
a Immunoblots showing the levels of the PEP complex and the PEP component rpoB in 4-d-old Col-0, phyA-211 (phyA), and cry1/cry2 (cry1/2) seedlings grown in the dark (D) or in 10 μmol m−2s−1 monochromatic red (R), far-red (FR), or blue (B) light. Total protein was isolated under either native or denaturing conditions and resolved via BN-PAGE or SDS-PAGE to assess the fraction of rpoB in the PEP complex or the amount of total rpoB by immunoblots, respectively. RPN6 was used as a loading control. The numbers below the immunoblots represent the relative PEP levels, which were estimated using the relative level of rpoB in the PEP complex (BN-PAGE) divided by the relative level of denatured rpoB (SDS-PAGE) in each sample. b qRT-PCR analysis of the steady-state transcript levels of psbA, psbB, and rbcL in 4-d-old Col-0, phyA-211 (phyA), and cry1/cry2 (cry1/2) seedlings grown in the dark or the light conditions described in a. The transcript levels were calculated relative to those of PP2A. The numbers above the columns indicate the fold changes compared with Col-0 in the dark. Error bars represent the s.e. of three biological replicates, and the centers of the error bars represent the mean values. Samples labeled with different letters exhibited statistically significant differences (ANOVA, Tukey’s HSD, P ≤ 0.05, n = 3). c Heatmap showing the relative expression of 12 PAPs and 6 SIGs in 3-d-old Col-0 during the transition from dark to red (R), far-red (FR), blue (B), and while light (WL) for 1 or 3 h. The source data underlying the immunoblots in a, qRT-PCR analysis in b, and the heatmap in c are provided in the Source Data file.

