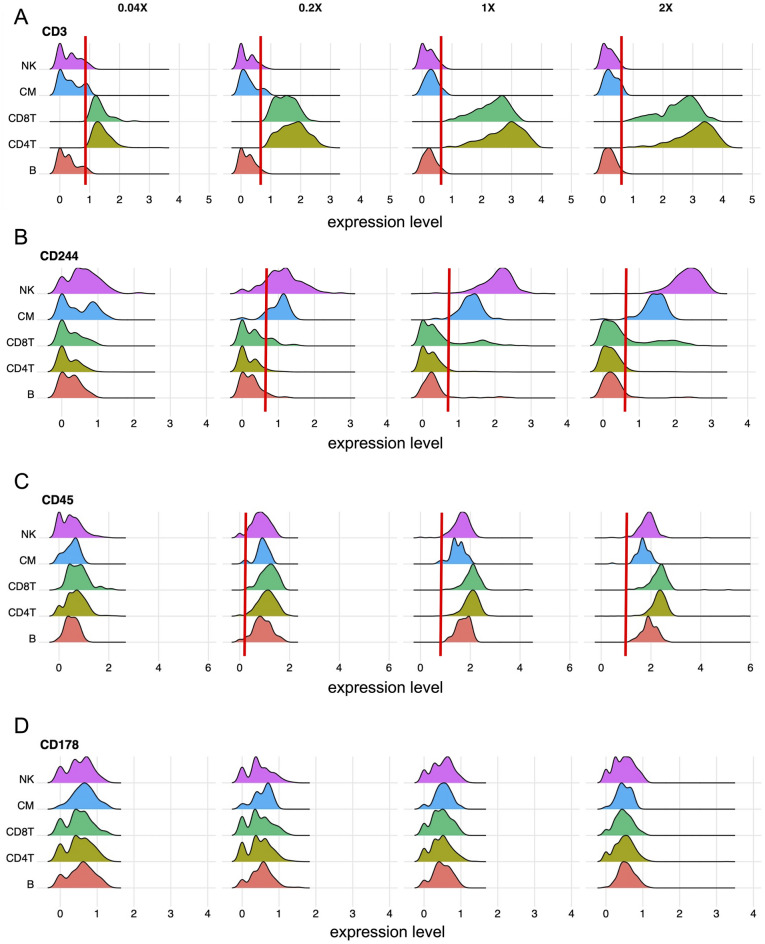
Figure 2.
Exemplary ridge plots used to threshold antibodies and to evaluate antigen expression. (A) shows an exemplary antigen (CD3) which was detectable at all dilutions. In contrast, CD244 shown in (B) was not detected at the lowest concentration (0.04 ×). (A, B) Antibody thresholds, indicated with red lines, were set to the upper limits of negative populations. (C) Some antigens, such as CD45, were detectable in all cells, as expected. Thus, negative populations did not exist. Here, antibody thresholds (red lines) were set to the lower limits of positive populations. If a considerable amount of expression values and the lower limit of the populations were negative, thresholds were not called (as for the 0.04 × concentration in the CD45 example). The exemplary antigen (CD178) shown in (D) was not detectable at any concentration. (A–D) Expression values were centered log-ratio (CLR) normalized.

