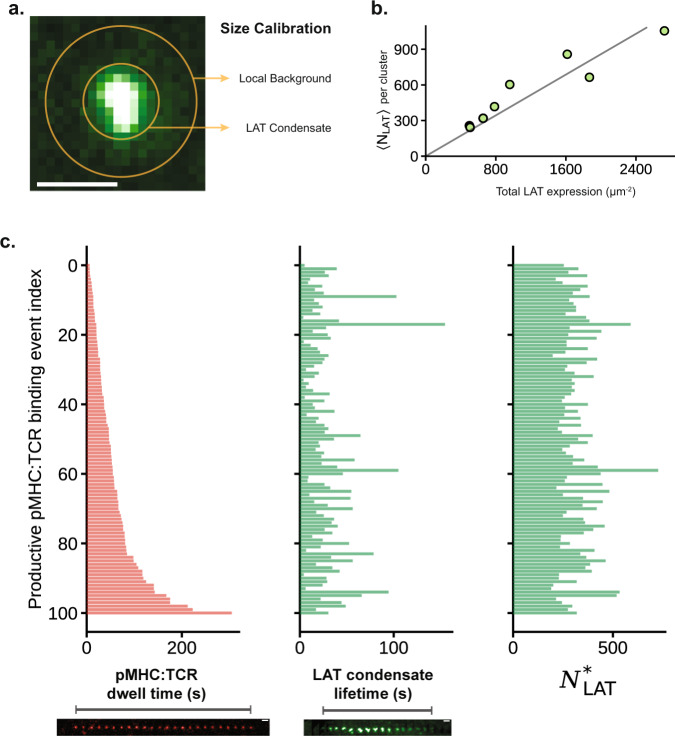
Fig. 2. Physical properties of the LAT condensate.
a An annulus around the LAT condensate is used to sample the local background. The intensity of the condensate is calculated as the midpoint of the net intensity and total intensity, since the extent of background LAT clustering is unknown. Scale bar is 1 μm. b Scatter plot of the average number of LAT within condensates, , as a function of the total LAT expression level (endogenous LAT + exogenous LAT-eGFP). Each point is a cell average over condensates observed within the first 5 min of cell landing. The fitted line has the equation , which was constrained to have 0 intercept. All cells were from the same mouse. Cells from two other mice yielded similar fits, and . c Three bar plots showing the lack of correlation between pMHC:TCR dwell time (left) with either the LAT condensate lifetime (middle) or the number of LAT within its associated condensate (right). Each red bar is a pMHC:TCR binding event, data is pooled from the 8 cells in panel b. The relative size of the LAT condensate is calculated as . is the relative size (RS) of the condensate rescaled using an estimated physiological (zero exogenous) LAT density of . This normalizes LAT cluster size to LAT expression level for cell-to-cell comparisons. Related data are in Supplementary Fig. 2. Source data are provided as a Source data file.

