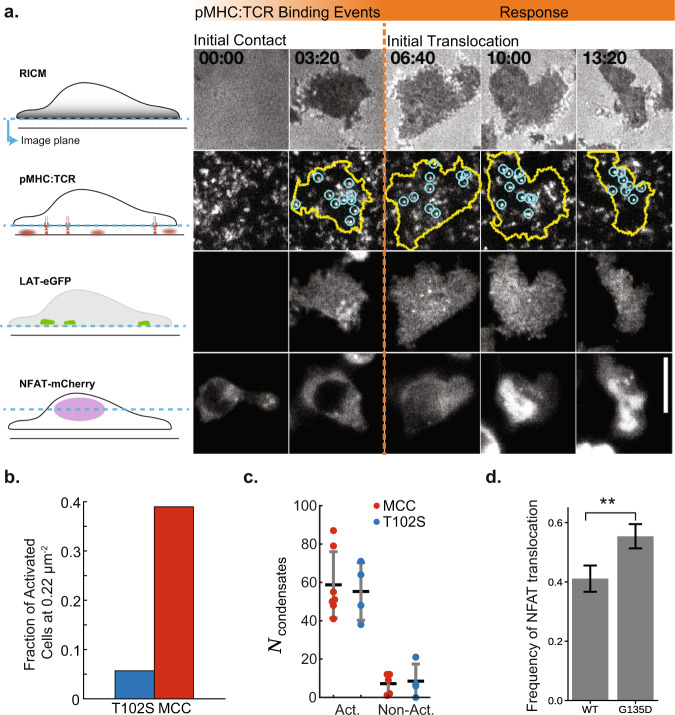
Fig. 6. Modulating LAT condensate delay time alters antigen discrimination thresholds.
a Images of key molecular steps leading to NFAT translocation through time within primary T cells. The cells were deposited onto supported membranes containing ICAM-1 and MCC(Atto647) pMHC. First row, RICM detects cell spreading and ensures the T cell has good contact with the supported membrane. Second row, TIRF images of individual pMHC:TCR binding events (blue) are recorded within the cell perimeter (yellow). Third row, TIRF images of LAT-eGFP is monitored for condensation events. Fourth row, epifluorescence images of NFAT to track moment of translocation. Scale bar is . b Bar plot showing the frequency of T cells that undergo NFAT translocation for either T102S () or MCC () at a fixed peptide-MHC density of . c Plot showing the number of distinct LAT condensates formed prior to NFAT translocation when exposed to different peptides. For cells exposed to MCC functionalized bilayers, 7 activated with SEM distinct LAT condensates, while 5 failed to activate after 300 s with SEM. Similarly, for cells exposed to T102S functionalized bilayers, 4 activated cells had SEM distinct LAT condensates, while 4 that failed to activate after 300 s had SEM. d Bar plot showing the frequency of NFAT translocation for T cells on T102S-MHC bilayers (at ) after 30 min for WT LAT ( SEM) or LAT-G135D ( SEM). The p-value was 0.02 as determined by a two-sided t-test. Source data are provided as a Source data file.

