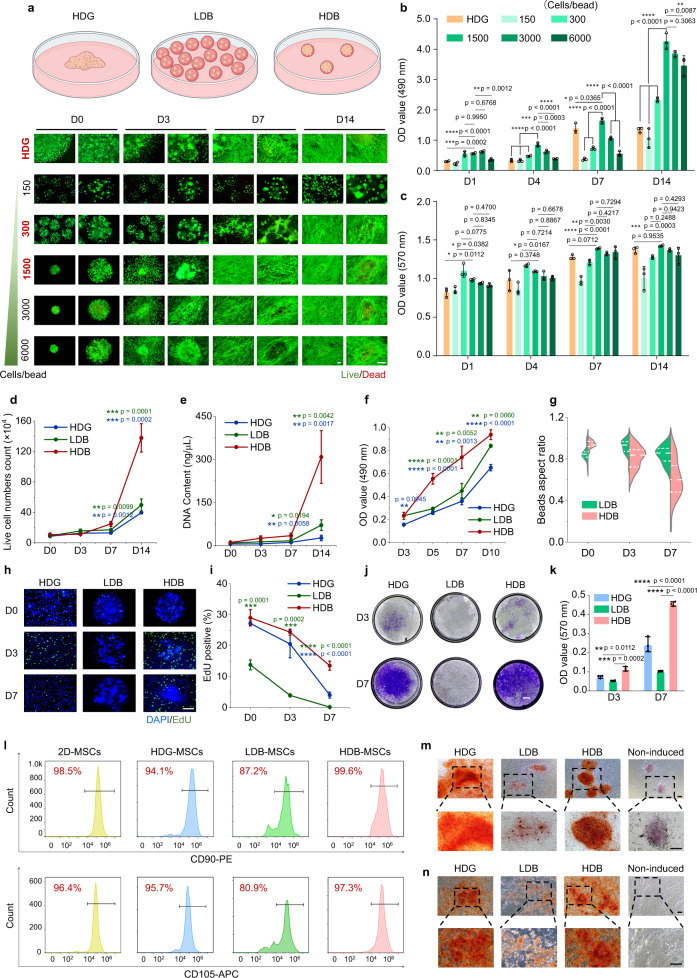
Fig. 3. Characterization of MSCs proliferation, migration, and stemness possession in Matrigel HDG, LDB, and HDB groups.
a The schematic illustration of MSCs growth in the HDG, LDB, and HDB groups. Cell viability of MSCs in HDG and microbeads of different cell densities, including 150, 300, 1500, 3000, and 6000 cells per microbead, were characterized at day 0 (D0), D3, and D7, and D14 using live/dead staining. The initial cell numbers were kept consistent among all groups. Scale bar, 100 µm. b OD values of MSCs growth at 490 nm at D1, D3, D7, and D14, determined using the LDH-CyQuant assay. n = 3. c Metabolic activity of MSCs at D1, D3, D7, and D14, determined using the Alamar Blue assay. n = 3. d and e Quantification of cell number (d) and DNA content (e) of MSCs at D0, D3, D7, and D14. d Live cell counts using a hemocytometer. n = 3. e DNA content acquisition. n = 3. f OD values of MSCs growth at 490 nm at D3, D5, D7, and D10, determined using the MTT assay. n = 3. g Aspect ratios of Matrigel LDB and HDB beads at D0, D3, and D7. n = 40. h and i Representative images of EdU labeling (h) and quantification (i) of EdU-positive MSCs at D0, D3, and D7. n = 3. Green: EdU, blue: DAPI. Scale bar, 200 µm. n = 3. j and k Crystal violet staining of cell migration assay (j) and OD values at 570 nm of crystals dissolved in ethylic acid (k). n = 3. Scale bar, 1 mm. l Flow cytometry quantification of MSC markers CD90, CD105. MSCs were cultured in Petri dishes (2D condition), and in Matrigel HDG, LDB, and HDB groups for 4 days. m Osteogenic differentiation of microbead-MSCs from D0. n Osteogenic differentiation of MSCs retrieved from microbeads. Scale bar, 100 µm. b–g, i, k The data are represented as mean ± SD. The significant difference is determined by one-way ANOVA, followed by Tukey’s test. The significant differences between parallel groups are compared with the HDB group.

