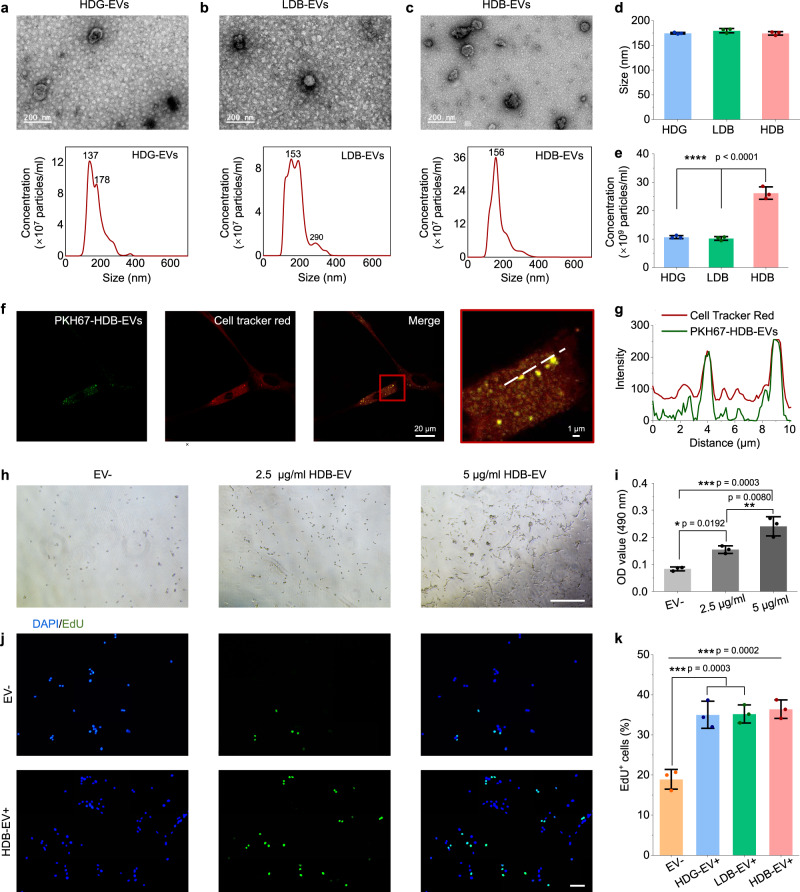
Fig. 5. Matrigel HDB group augments MSCs production of extracellular vesicles (EVs).
a–c Transmission electron microscopy (TEM) images and nanoparticle tracking analysis (NTA) of HDG-EVs (a), LDB-EVs (b), and HDB-EVs (c). Scale bars, 200 nm. d and e The size (mean diameter) (d) and particle concentration (e) of HDG-EVs, LDB-EVs and HDB-EVs. n = 3. f Colocalization between HDB-EVs and C2C12 cells. PKH67-labeled HDB-EVs were incubated with C2C12 for 48 h. Cells were stained with Dil cell membrane tracker. g Intensity profiles of two fluorescent channels (green, EVs; red, cell membrane) along the dashed line. h and i Representative bright-field images (h) and OD values of MTT assays for cell proliferation (i) of C2C12 cells without EV treatment (EV−) and with increased doses of HDB-EVs treatment for 48 h. n = 3. Scale bar, 500 µm. j and k Representative images of EdU staining (j) and quantification of EdU-positive C2C12 cells (k) without EV treatment (EV−) and with 10 µg/mL HDG-EVs, LDB-EVs and HDB-EVs treatment for 48 h. n = 3. Scale bar, 100 µm. d, e, i, k The data are represented as mean ± SD. The significant difference is determined by one-way ANOVA, followed by Tukey’s test. *p < 0.05; **p < 0.01; ***p < 0.001; ****p < 0.0001.

