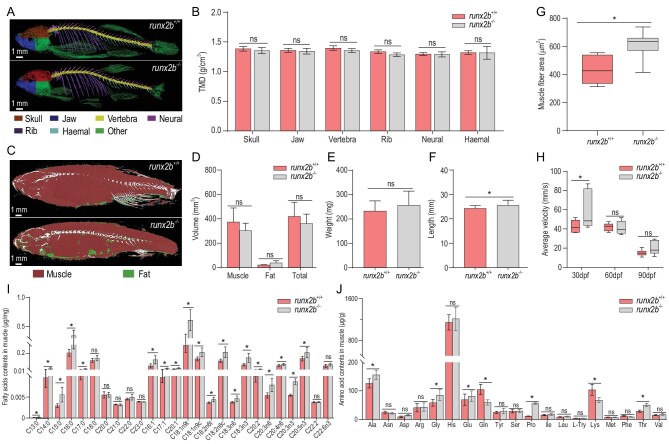
Figure 4.
Comparison of characteristics of other bones, swimming performance and muscle nutrient content between runx2b+/+ and runx2b−/− zebrafish. (A and B) Tissue mineral density (TMD) value of six distinctive bone elements. (C and D) Quantification of muscle and fat volumes. (E and F) Body weight and body length. (G) Muscle fiber area of tail muscles, calculated based on hematoxylin and eosin (HE)-stained sections. (H) Average swimming velocity. (I) Fatty acid contents in the muscle tissue of zebrafish at 90 dpf. (J) Amino acid contents in the muscle tissue of zebrafish at 90 dpf. ns, P > 0.05; *, P < 0.05.

