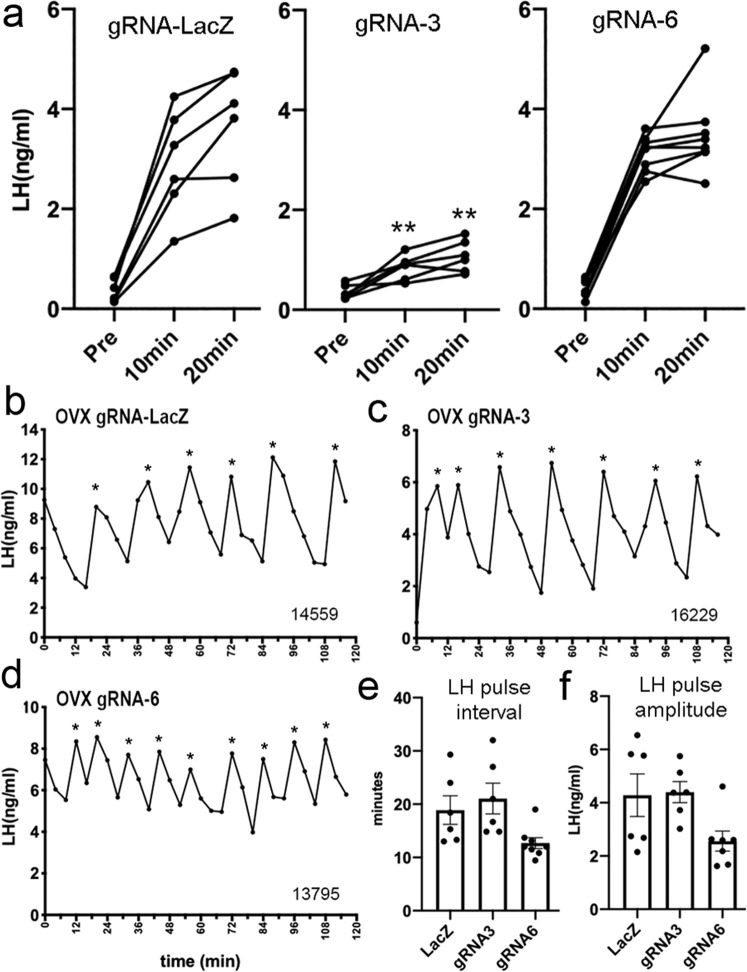
Fig. 7. Pituitary function and effects of ovariectomy in mice with knockdown of ESR1 in adult ARNKISS neurons.
a Individual profiles of LH secretion in mice from the three gRNA groups showing LH levels before (Pre) and then 10 and 20 min following a bolus s.c. administration of GnRH. **P = 0.002 at both time points versus LacZ (Mann–Whintey). b–d Representative LH pulse profiles obtained from 3-week ovariectomized mice from the three gRNA groups. Asterisks indicate pulses detected by PULSAR and numbers identify the individual mice (their intact profiles are shown in Fig. 6). e, f Mean ± SEM and individual data points for LH pulse intervals and amplitudes in 3-week OVX mice from the gRNA-LacZ (LacZ, N = 6), gRNA-ESR1-3 (gRNA3, N = 6), and gRNA-ESR1-6 (gRNA, N = 7) experimental groups. No significant differences were detected between groups. Source data are provided as a Source Data file.

