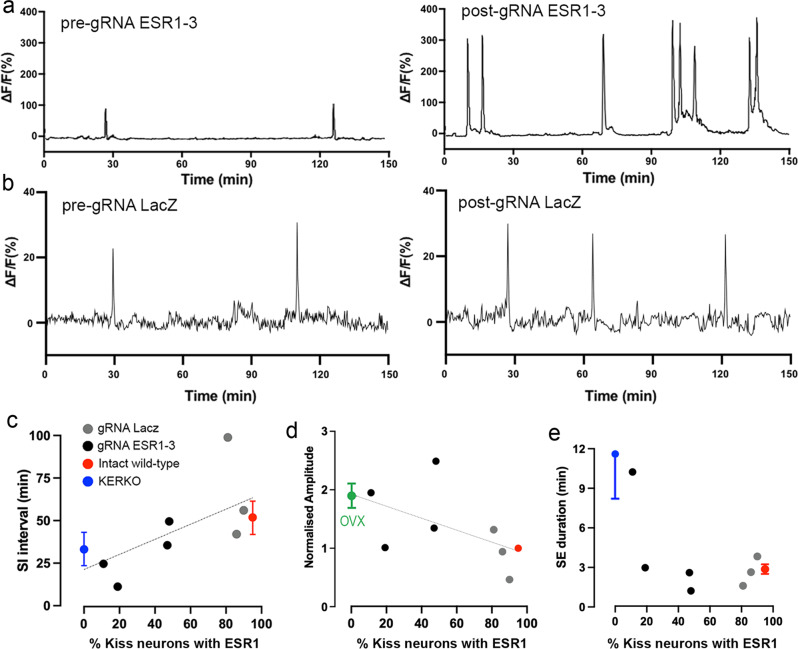
Fig. 8. Effects of CRISPR knockdown of ESR1 on ARNKISS neuron synchronization events (SEs).
a Photometry traces before and 3 weeks after infusion of gRNA ESR1-3 into the ARN. b Photometry traces before and 3 weeks after infusion of control gRNA LacZ into the ARN. c Individual SI intervals of SEs from mice given gRNA LacZ (gray, N = 3), gRNA ESR1-3 (black, N = 4) and, for comparison, the mean ± SEM values for the same parameter recorded from intact wild-type (red) and KERKO (blue) mice plotted against the percentage of ARNKISS neurons expressing ESR1. d Normalized SE amplitude plotted against % kisspeptin with ESR1 for individual CRISPR mice (N = 3 or 4 per experimental group) and, for comparison, mean ± SEM values from OVX (green) and intact mice. Values show amplitude normalized to pre-OVX or pre-AAV-gRNA infusion. e SE duration values for individual CRISPR mice (N = 3 or 4 per experimental group) and, for comparison, mean ± SEM values for KERKO and intact mice (N = 6 for each experimental group). Source data are provided as a Source Data file.

