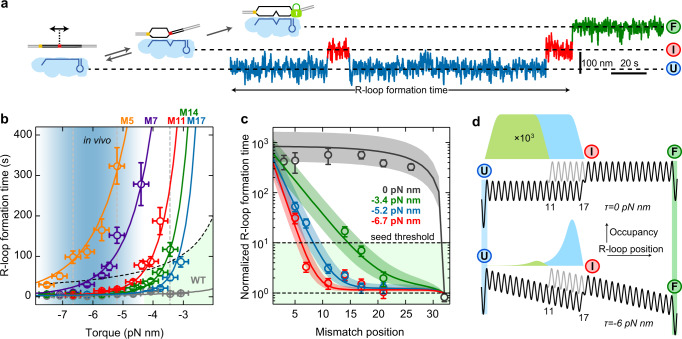
Fig. 4. Locked R-loop formation on targets with single internal mismatches.
a Sketch of the DNA construct containing a single C:C mismatch at various positions along the target (left). Example trajectory of full R-loop formation for a mismatch at position 17 after applying negative supercoiling. The full R-loop is formed after multiple intermediate state events. b Torque dependence of the R-loop formation time for different mismatch positions. Circles represent mean times from >27 events collected on at least two molecules. Solid lines represent a global fit of the random-walk model to the data. The light blue gradient marks the torque range estimated in vivo (see Methods). The light green area corresponds to a less than 10-fold increase of the R-loop formation time compared to the WT. Errors of the formation time are SEM and of the torque 0.25 pN nm. c Normalized R-loop formation time with respect to the WT (open circles, obtained from data in (b), as well as Supplementary Fig. 6a, f) as a function of the mismatch position for three different torques (corresponding to the vertical dashed lines in (b)). Solid lines show the predictions of the random-walk model using the fit parameters from (b). Colored areas represent single confidence intervals of the fits. Error bars correspond to SEM. d Comparison of the occupancies of the intermediate R-loop state for mismatches at positions 11 and 17 in the absence (upper panel) and presence (lower panel) of negative torque. Precise sample sizes are given in the Supplementary Table 6. Source data are provided as a Source Data file.

