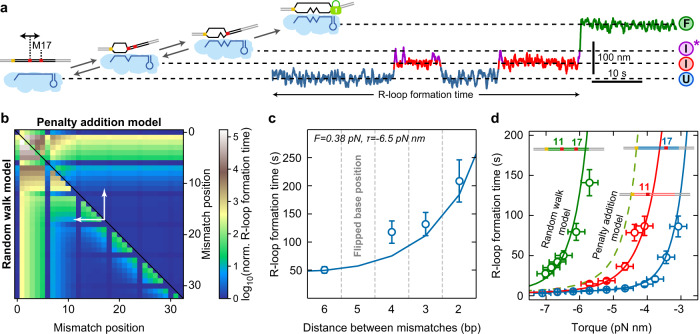
Fig. 6. Locked R-loop formation on targets containing double mismatches.
a Sketch of the DNA construct containing a first C:C mismatch at positions varying from 11 to 15 and a second C:C mismatch at position 17 (left). Example trajectory of full R-loop formation with the first mismatch located at position 11 containing two intermediate states and . b Predicted R-loop formation time for double mismatches relative to the matching target using the penalty for a C:C mismatch and torque of −6.5 pN nm. Either the penalty addition model (upper right half) or the random walk model (lower left half) was applied. For mutations at positions 6, 12, 18, 24, and 30 no penalties were considered due to the disrupted base-pairing in the crRNA–DNA hybrid. White arrows indicate the range of considered mismatch distances between positions 11 and 17. c Experimental R-loop formation times on targets with double mismatches with a variable position of the first mismatch and a fixed position of 17 for the second mismatch. The solid line represents the model prediction using the parameters from the single mismatch experiments (see Supplementary Table 1). Error bars correspond to SEM. d R-loop formation time as a function of torque for targets with single mismatches at positions 11 and 17 and the target containing both mismatches. Solid lines represent the model prediction using the parameters from the single mismatch experiments (see Supplementary Table 1). The dashed line represents the prediction of the penalty addition model for the target with both mismatches. Error bars correspond to SEM; torque errors correspond to 0.25 pN nm. Precise sample sizes are given in the Supplementary Table 6. Source data are provided as a Source Data file.

