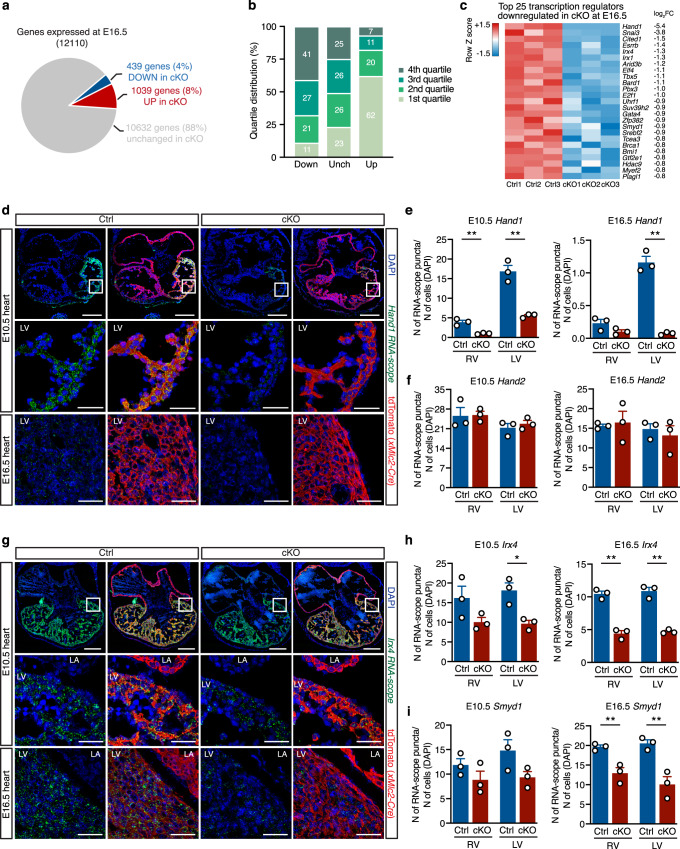
Fig. 3. DOT1L is required in cardiomyocytes for chamber-specific gene expression.
a Pie chart representing the number of genes down- (log2FC ≤ −0.5; FDR ≤ 0.05) and up-regulated (log2FC ≥ 0.5; FDR ≤ 0.05) in Dot1L cKO CMs at E16.5. b Quartile distribution of gene expression in CMs at E16.5. Genes downregulated (Down) in Dot1L cKO were expressed at a high level in control CMs, whereas the majority of upregulated genes (Up) belonged to the bottom quartile of expression. Genes not significantly modulated (Unch) were evenly distributed across quartiles of expression. Data are shown as stacked percentage bar graph. c Heatmap showing the expression of the top 25 transcription regulators downregulated in Dot1L cKO CMs at E16.5, highlighting that multiple chamber-specific transcription regulators were significantly downregulated. RNA-scope analyses (d) and respective quantification (e) validating blunted expression of Hand1 in Dot1L cKOs both at E10.5 and E16.5. (N = 3 biological replicates; unpaired t-test, two-sided, E10.5 RV P = 0.0042, E10.5 LV P = 0.0020, E16.5 LV P = 0.0003). f Quantification of RNA-scope analysis validating no changes in expression of Hand2 in Dot1L cKOs both at E10.5 and E16.5 (RNA-scope images presented in Supplementary Fig. 4) (N = 3 biological replicates). RNA-scope analyses (g) and respective quantification (h) validating reduced levels of Irx4 in Dot1L cKOs both at E10.5 and E16.5. (N = 3 biological replicates; unpaired t-test, two-sided, E10.5 LV P = 0.0153, E16.5 RV P = 0.0006, E16.5 LV P = 0.0005). i Quantification of RNA-scope analysis validating reduced levels of Smyd1 in Dot1L cKOs both at E10.5 and E16.5 (RNA-scope images presented in Supplementary Fig. 3). (N = 3 biological replicates; unpaired t-test, two-sided, E16.5 RV P = 0.0057, E16.5 LV P = 0.008). For panels d and g scale bars = 250 μm for low magnification panels and 50 μm for high magnification images. In panels e, f, h and i data is presented as mean ± SEM; * represents P ≤ 0.05, **P ≤ 0.01. (N = 3 biological replicates). Source data are provided as a Source Data file.

