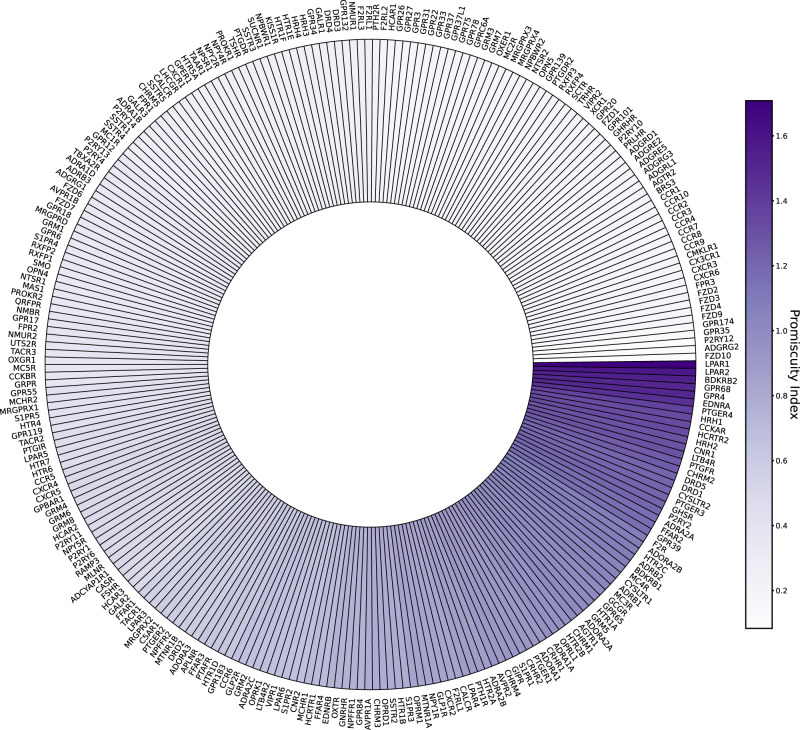
Fig. 1. GPCRs exhibit a spectrum of coupling strength to G-proteins; from selective interaction with a single G protein to promiscuous coupling across G protein subfamilies.
GPCRs studied in Inoue et al.11 and Avet et al.12 along with those annotated in the IUPHAR database were compared to assess GPCR coupling selectivity across major G protein subfamilies. We calculated a “promiscuity index” and ranked GPCRs based on this index, taking into consideration the strength of evidence for coupling based on the type of assay or reporting used. The circularized bar plot displays the spectrum of promiscuity as denoted by the color heatmap at the right of the figure. Source data are provided as Supplementary Data 1.

