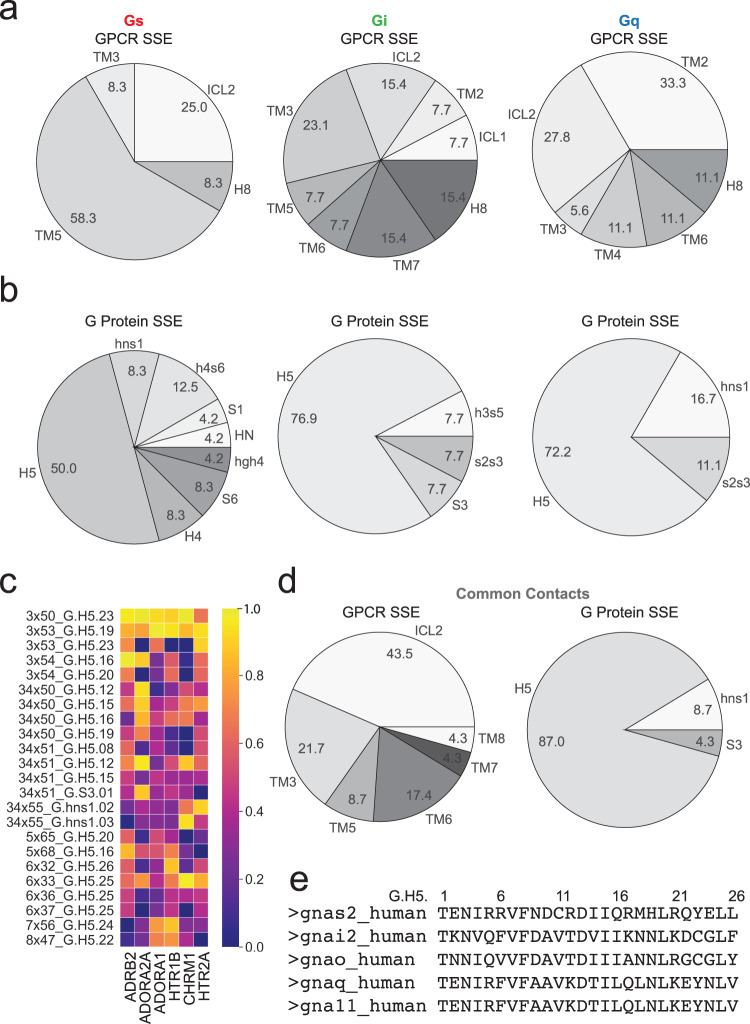
Fig. 3. Unique signatures of GPCR and G protein structural regions involved in contacts from different G protein families.
The location of the G protein family “specific contacts” mapped to the various GPCR and G protein secondary structural elements (SSE). Source data for all plots are provided as Supplementary Data 2. a The percentage of GPCR:G protein contacts specific to the Gs (left), Gi (center), and Gq (right) interaction arising from each SSE of the GPCR is shown. b Similar pie chart displaying the percentage of contacts from specific SSEs of the G proteins. The residue numbering system used is from the “common G protein numbering” scheme developed by Flock et al.41. c The temporal frequency of each GPCR:G protein “common contact” is displayed, indicating the frequency of each contact for each GPCR system. d The amino acids found among “common contacts” are shown in the pie charts, labeled by the SSE in which they are found. e FASTA sequence alignment of G protein C-terminal H5 helix for G proteins used in MD simulations.

