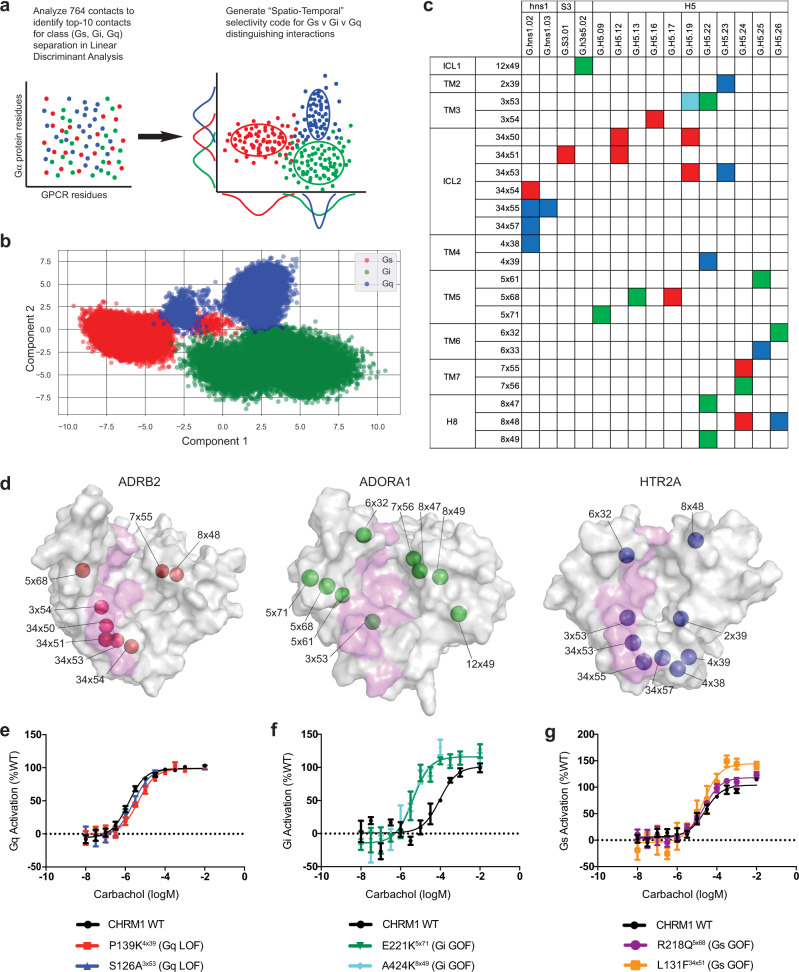
Fig. 4. Identifying G protein selectivity determinants using linear discriminant analysis of spatiotemporally resolved GPCR:G protein contacts.
a GPCR:Gα protein contacts from each frame of the MD simulations were one-hot encoded into a binarized interaction fingerprint and used to train a linear discriminant classifier and identify features (intermolecular contact pairs) that distinguish Gs, Gi, and Gq interactions. b The projection of each frame of the MD simulations, colored by G protein interaction (red, Gs; green, Gi; blue, Gq) are shown projected into the two-dimensional deconvoluted space (Component 1, Component 2) determined by the linear discriminant analysis. Source data are provided as Supplementary Data 4. c The top ten pairwise contacts which contribute highly to the interaction signature of each G protein family are displayed in the spatio-temporal barcode as the GPCR (rows) and G protein (columns) residues that are found in the distinguishing pairwise contacts for each G protein interaction (red, Gs; green, Gi; blue, Gq). One contact (‘3×53:G.H5.19’) is shared among Gi and Gq type interactions, and is colored in “cyan.” d GPCR residues involved in G protein selectivity are displayed on the intracellular surface of a Gs (ADRB2, red spheres, left), Gi (ADORA1, green spheres, center), and Gq-coupled (HTR2A, blue spheres, right) GPCR. Residues that are found in “common contacts” across G protein subfamilies are shown as a magenta-colored surface. e BRET-based Gq-activation sensor was used to measure CHRM1 (WT, P139K and S126A mutants) activation of Gq heterotrimers in the presence of carbachol (n = 3 biologically independent samples, data are presented as mean ± SD for each concentration). f BRET-based Gi-activation sensor was used to measure CHRM1 (WT, E221K, and A424K mutants) activation of Gi heterotrimers in the presence of carbachol (n = 3 biologically independent samples, data are presented as mean ± SD for each concentration). g BRET-based EPAC sensor was used to measure CHRM1 (WT, P139K and S126A mutants) activation of Gs signaling and cAMP accumulation in the presence of carbachol and 500 nM of Gq-protein inhibitor YM-254890 (n = 3 biologically independent samples, data are presented as mean ± SD for each concentration).

