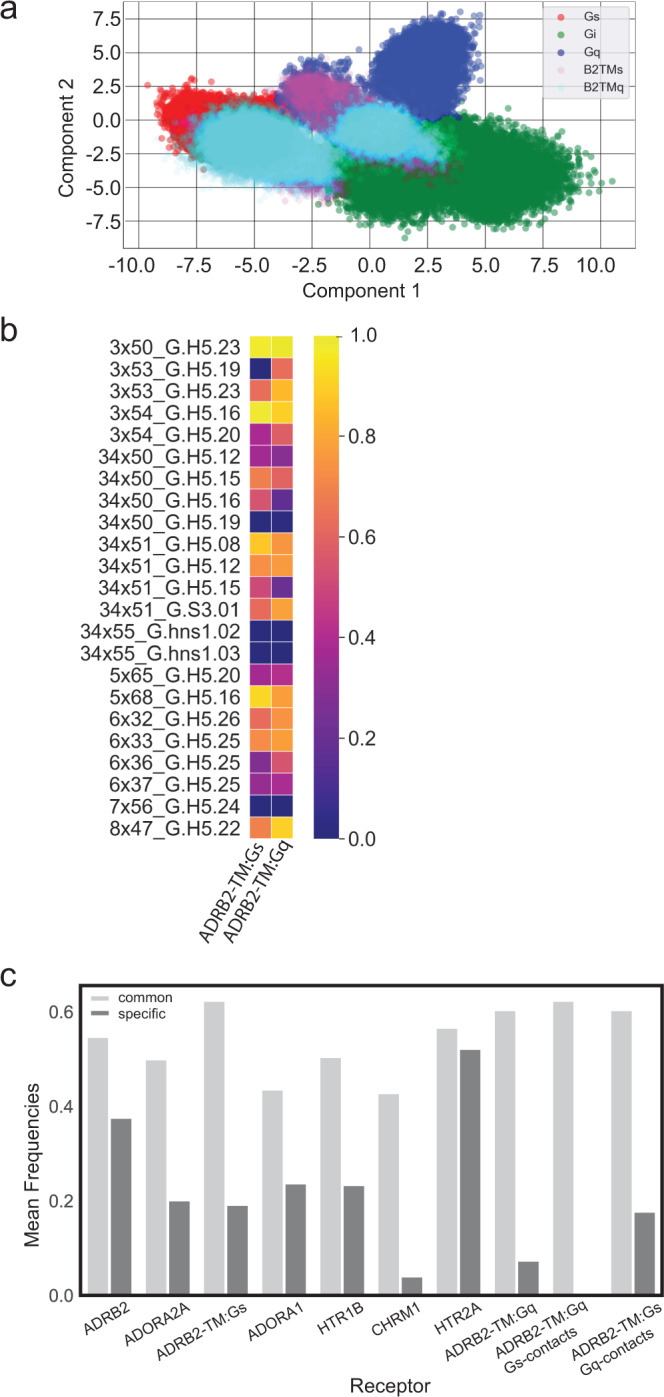
Fig. 5. The GPCR:G protein contact landscape of promiscuous GPCRs.

a Analysis of promiscuous GPCRs in the framework of the LDA model trained on data from the original six structurally resolved GPCR:G protein complexes. The promiscuous GPCR:G protein interactions are plotted using the feature weightings used to compute Component 1 and Component 2 from the LDA analysis performed in Fig. 4. The promiscuous GPCRs are distinguished by color and denoted in the legend: ADRB2-TM with Gs (“B2TMs”, magenta), ADRB2-TM with Gq (“B2TMq”, cyan). The plotting of these promiscuous receptor interactions lie predominantly in the common space of the LDA model, suggesting the promiscuous receptor interactions with G proteins are represented by mostly non-distinguishing contacts. b Heatmap of contact frequencies for “common contacts” sampled in the promiscuous ADRB2-TM receptor. Source data are provided as Supplementary Data 3. c The promiscuous GPCRs studied here show stronger sampling (measured by mean frequency per residue) within the subspace of “common contacts” pairs (light gray), and less frequent sampling of G protein family “specific contact” pairs sampled within the G protein family to which they are coupled (medium gray). For the promiscuous ADRB2-TM, we calculated the mean frequency of subfamily specific contacts for the G protein-coupled within the simulation (ADRB2-TM:Gq, ADRB2-TM:Gs), and the mean frequency of subfamily specific contacts for the opposite G protein family, while coupled to one of the G proteins (ADRB2-TM:Gq with Gs-contacts, ADRB2-TM:Gs with Gq-contacts).
