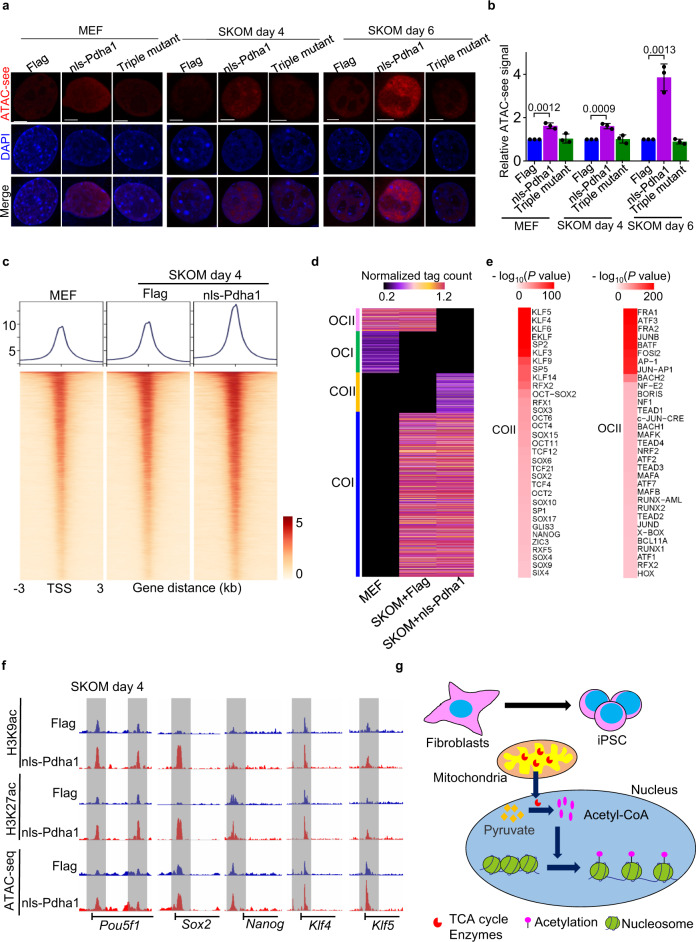
Fig. 6. Nuclear Pdha1 loosens chromatin of pluripotency genes and promotes somatic cell reprogramming.
a Representative images of ATAC-see (red) in MEFs before and after transduction with SKOM plus nls-Pdha1, Triple mutant or Flag at day 4 and day 6. Scale bars, 5 µm. b Quantification of the relative levels of ATAC-see signal represented in a. Data are presented as the mean ± S.D and n = 3 independent experiments. At least 30 nuclei were counted in each experiment. A two-tailed unpaired Student’s t test was used. c Heatmap and pileup of ATAC-seq signal near the TSS (upstream 3 kb and downstream 3 kb of the TSS) in MEFs and MEFs transduced with SKOM plus nls-Pdha1 or Flag on day 4. Three replicates (n = 3, each group) were used for the ATAC assay. d Heatmap of ATAC-seq OC/CO loci at day 4 during reprogramming: closed in Flag but open in Flag+SKOM and nls-Pdha1+SKOM (COI), closed in Flag and Flag+SKOM but open in nls-Pdha1+SKOM (COII), open in Flag but closed in SKOM + Flag and SKOM + nls-Pdha1 (OCI), open in Flag and SKOM + Flag but closed in SKOM + nls-Pdha1 (OCII). Units are in normalized sequence tag counts. Three replicates (n = 3, each group) were used for ATAC assay. e TF motifs significantly enriched at least >1.5-fold in COII (left) and OCII (right) peaks defined in d. The motif enrichment was conducted using the findMotifsGenome.pl module in HOMER. Three independent experiments were repeated with similar results, and three replicates (n = 3, each group) were used for this analysis. f Selected genome views for H3K9ac and H3K27ac ChIP-seq data and ATAC-seq in reprogramming on day 4 with or without expression of nls-Pdha1. Regions of open chromatin are marked with a gray box. Genome views: Nanog (chr6:122,704,483–122,716,633), Pou5f1 (chr17:35,504,032–35,512,777), Klf4 (chr4:55,525,137–55,534,475), Sox2 (chr3:34,647,995–34,654,461) and Klf5 (chr14:99,296,691–99,315,412). All genome views are on the same vertical scale. g Schematic diagram represents the mechanism of nuclear translocation of Pdha1 in regulating cell fate through epigenetic regulation.

