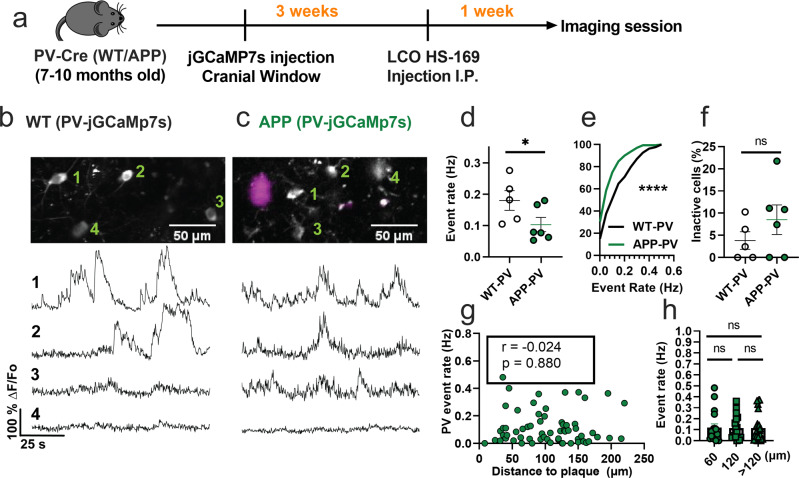
Fig. 2. PV interneurons are hypoactive in APP/PS1 mice relative to WT mice.
a Timeline of the experimental procedures. b, c Top, in vivo two-photon fluorescence images of jGCaMP7s in PV expressing interneurons (grey) in layer 2/3 of the somatosensory cortex from WT (b) and APP/PS1 (c) mice. Amyloid plaques were labeled with LCO- HS-169 (magenta); Scale bars, 50 μm. Bottom, representative normalized fluorescence traces from control (b) and APP/PS1 (c) mice. Representative images were created by averaging 500 images from PV interneuron recordings at 256×256 resolution with green numerical labels to the right of each representative cell. d Mean event rates (Mann–Whitney U = 4, p = 0.051, two-tailed, n = 5 WT-PV mice; 6 APP-PV mice). e Cumulative frequency distribution of event rates in all imaged neurons (KS-test:D = 0.268, p < 0.0001, n = 254 WT-PV neurons; 172 APP-PV neurons). f Quantification of the fraction of inactive cells (Mann–Whitney U = 4, p = 0.28, two-tailed) in imaged WT-PV and APP-PV (n = 5 WT mice; 6 APP/PS1 mice). g Correlations between event rates and the distance to amyloid plaque center in PV interneurons (Spearman correlation: r(63) = −0.024, p = 0.88), and h quantification of pooled PV event rates as a function of amyloid plaque distance (Kruskal–Wallis test, H(2) = 0.46, p < 0.79). Each solid circle in d–f represents an individual animal, while each circle in g, h represents an individual neuron. All error bars reflect the mean ± s.e.m. Asterisks denote statistically significant differences (*p < 0.05, ****p < 0.0001), while ‘ns’ denotes no significance p > 0.05.

