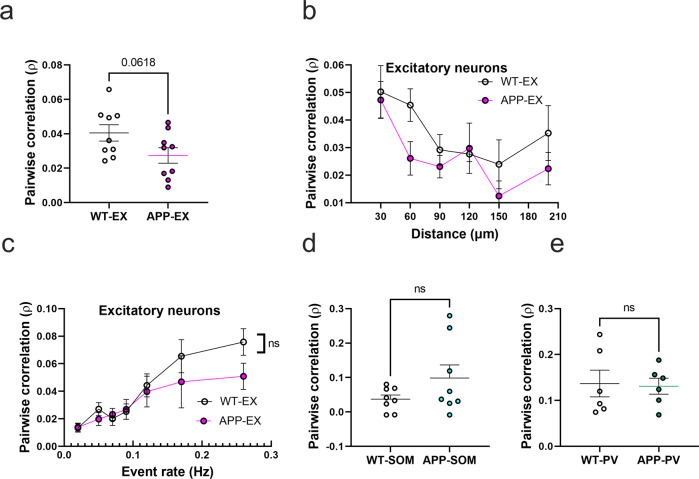
Fig. 4. Pairwise neuronal correlations in APP/PS1 mice.
a Average pairwise Pearson correlation values for excitatory neurons in APP/PS1 and WT mice (t(16) = 2.008, n = 9WT-EX mice, n = 9 APP-EX mice, p < 0.062, two-tailed). b Relationship between pooled pairwise Pearson correlation values and pairwise interneuronal distance (Two-Way ANOVA, main distance effect F(5, 87) = 4.5, p = <0.001, main genotype effect F(1, 87) = 4.38, p = 0.039, main genotype and distance interaction F(5, 87) = 0.62, p = 0.682). The x axis values represent the maximum limit of the pooled pairwise distances. c Relationship between correlation values and event rates after pooling data according to geometric means of neuronal event rates (two-way ANOVA, main event rate effect F(6,107) = 9.7, p < 0.0001, main genotype effect F(1, 107) = 24, p = 0.1223, main genotype and event rate interaction F(6, 107) = 0.7, p = 0.58). d, e Average pairwise Pearson correlation values for SOM interneurons (d) (t(14) = 1.54, n = 8 WT-SOM mice, n = 8 APP-SOM mice, p = 0.147, two-tailed) and PV interneurons (e) (t(10) = 0.16, n = 6 WT-PV mice, n = 6 APP-PV mice, p = 0.95, two-tailed) in APP/PS1 and WT mice. All error bars reflect the mean ± s.e.m.

