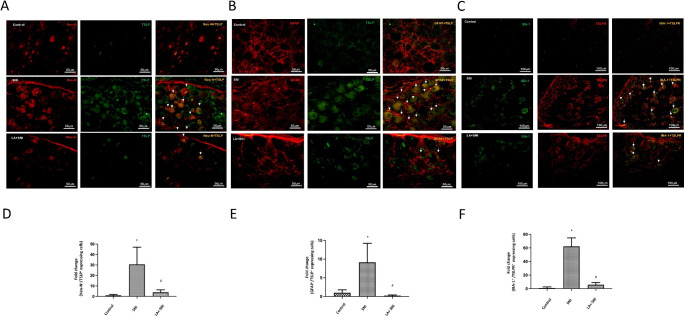
Fig. 4.
Role of LA on cellular distribution of TSLP in DRG of SNI rats. (A) Immunofluorescence images were obtained for TSLP (green) and Neu-N (red) in the DRGs. Merged double-positive cells were yellow and indicated white-arrow. LA decreased the amounts of merged cells. The scale bar represents 50 μm. (B) Immunofluorescence images were obtained for TSLP (green) and GFAP (red) in the DRGs. Merged double-positive cells were yellow and indicated white-arrow. LA decreased the amounts of merged cells. The scale bar represents 50 μm. (C) Immunofluorescence images were obtained for IBA-1 (green) and TSLPR (red) in the DRGs. Merged double-positive cells were yellow and indicated white-arrow. (D) LA decreased the amounts of merged TSLP and Neu-N cells, (E) merged TSLP and GFAP cells (F) merged IBA-1 and TSLPR cells. The scale bar represents 100 μm. n = 4 rats for each group. *P < 0.05 SNI group compared with the control group; and #P < 0.05 LA + SNI group compared with SNI group. All data are presented as mean ± SEM. The tissues were collected on the 7th day after SNI.

