Fig. 1.
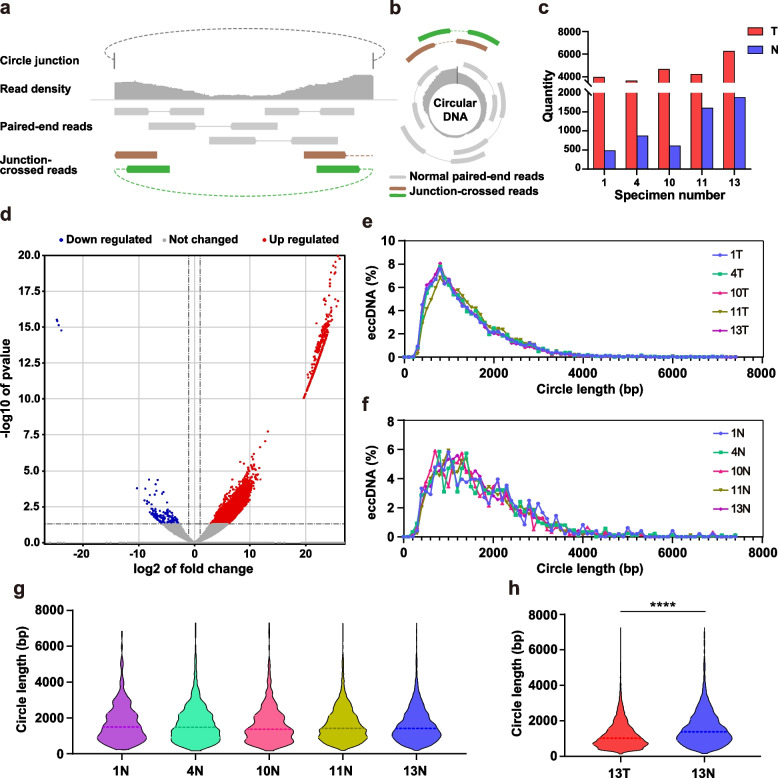
Length distribution of eccDNAs in CRC and normal tissue samples. a Schematic representation of eccDNA fragmentation mapping. b Schematic representation of circularization of tiled eccDNA. c Histogram of the quantity of eccDNA in each tumor group and normal group. Y-axis does not omit the intervals, only the percentages of 0–500 is increased to visualize the data in normal group. d Volcano plot for the comparison between the eccDNAs in tumor group and normal group. The cutoff values fold change > 2 and P value < 0.05 were utilized to identify differentially expressed genes. e-f Line chart of the percentage of length distribution of eccDNA in each tumor group and N. g Violin plots of the length distribution of eccDNA in 13 T and 13 N (n = 6058 in 13 T, n = 294 in 13 N, P < 0.0001). h Violin plots of the length distribution of eccDNA in each normal group. The dashed line is the median of each group

