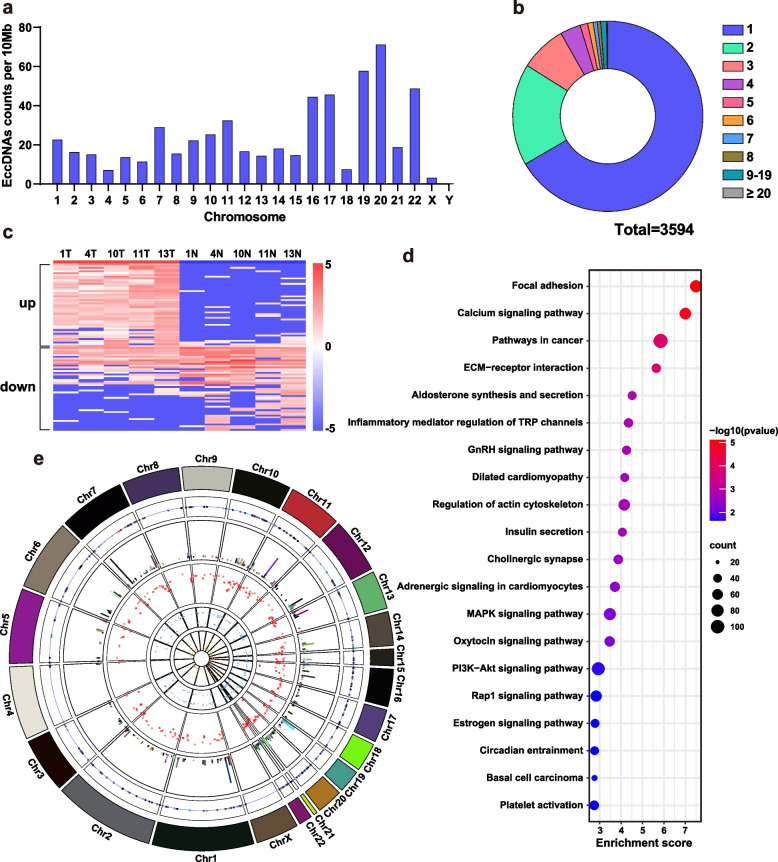
Fig. 2.
Counts distribution, gene expression and chromosomal distribution of eccDNAs in the samples. a Histogram of the eccDNA frequency per 10 Mb in each chromosome. b Pie chart of the percentages of genes (n = 3594) shedding different amounts of eccDNAs. c Heatmap consisting of the logarithm of the normalized values of the highly and lowly expressed genes in each tumor group and N (n = 47 in high and low expression respectively). d Scatter plot of enriched KEGG pathways statistics for genes (n = 3594) contained in eccDNAs in tumor group. e Circos plot of chromosomal distribution and expression levels of high-expressed eccDNAs in tumor group. Concentric circles are, in order from outside to inside: human chromosomes (chr1-chrX), after which the x-axis of all circles is chromosomal coordinate; chromosomal localization of eccDNAs; the basemean of the genes, with the y-axis showing the expression level; Rainfall plot of the degree of gathering of eccDNAs, and the y-axis corresponds to the minimal distance of the region to its two neighboring regions; the foldchange of the genes; the P value of the genes

