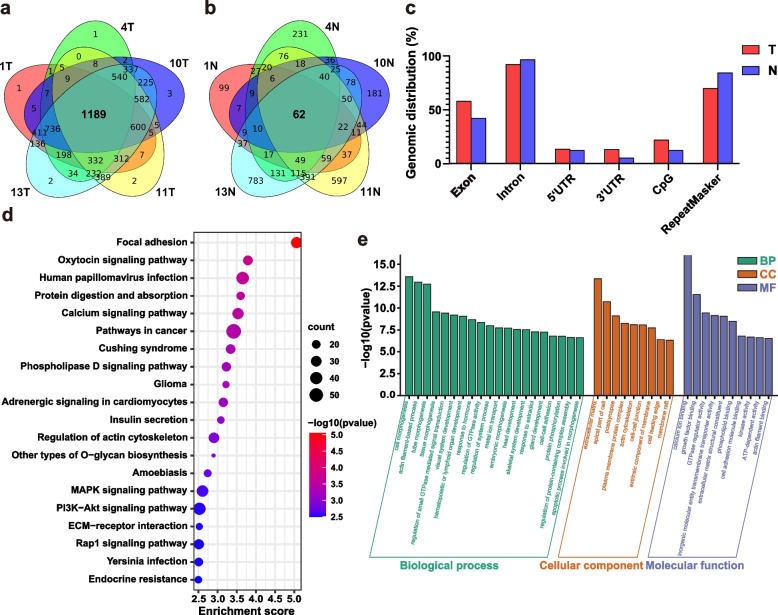
Fig. 3.
Gene regions and functional analysis of eccDNAs with concentrated high expression in CRC. a-b Venn diagram for eccDNA sequences common to each sample in tumor group and N, respectively. c Distribution of eccDNAs intersected in tumor group and N in the indicated genomic regions. d Scatter plot of enriched KEGG pathways statistics for genes (n = 1189) contained in eccDNAs shared in each tumor group. e GO functional classification of genes (n = 1189) contained in eccDNAs shared in each tumor group

