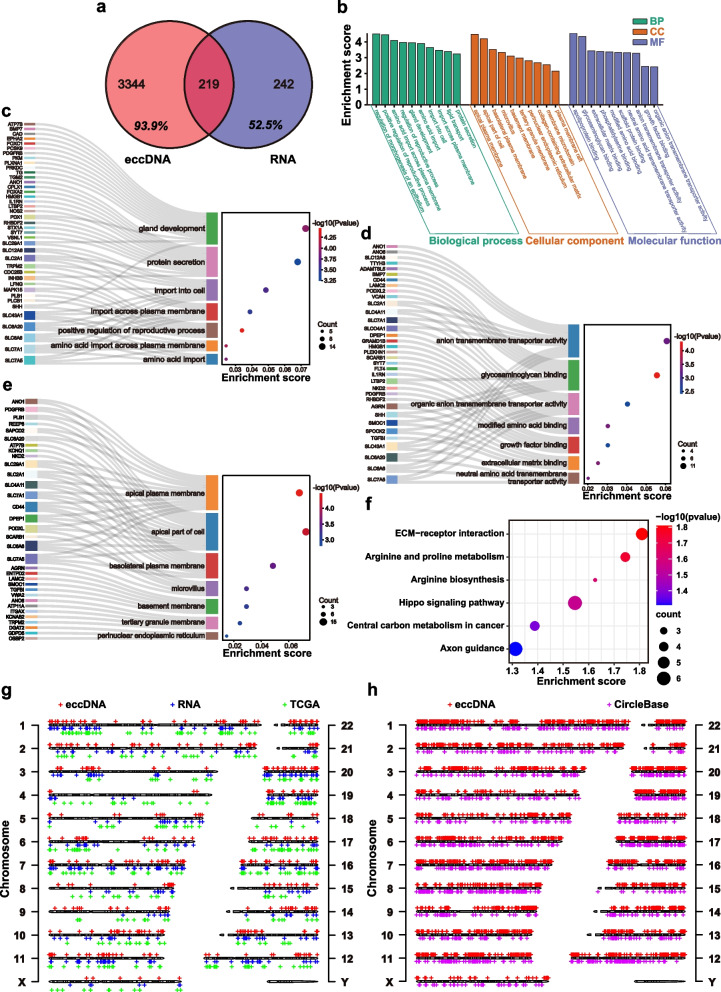
Fig. 4.
The association of genes contained in eccDNAs with RNA levels. a Venn diagram for genes differentially expressed in eccDNA and RNA. b GO functional classification of genes highly expressed in both in eccDNA and RNA. c-e Sankey plot for genes in biological process, cellular component and molecular function in Fig. 3b. f Scatter plot of enriched KEGG pathways statistics for genes (n = 219) highly expressed in both in eccDNA and RNA. g Genomic distribution of eccDNA (n = 500) and RNA (n = 461) in tumor group compared with TCGA samples (n = 495). h Genomic distribution of eccDNA in tumor group (n = 6275) and CircleBase (n = 1461)

