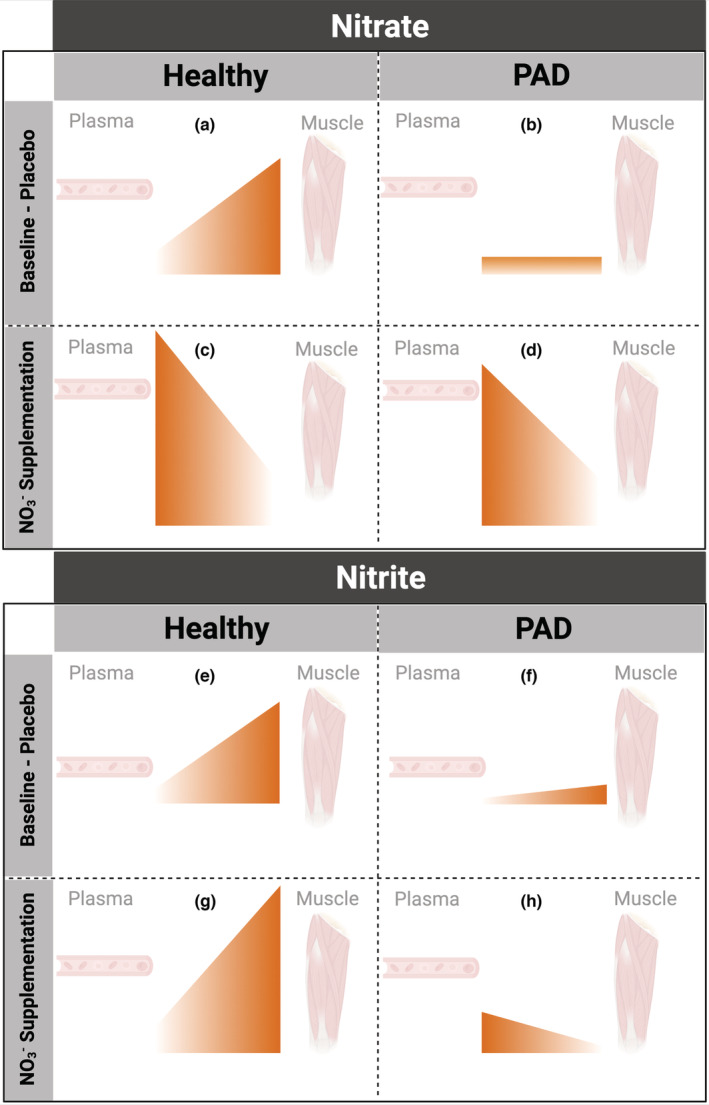
FIGURE 8.

Schematic representation showing a comparison of plasma and skeletal muscle nitrate (panels a–d) and nitrite (panels e–h) concentrations in healthy young subjects (previously reported) and individuals with peripheral arterial disease (PAD) at baseline/placebo (panels a, b, e, f) and following oral inorganic nitrate supplementation (panels c, d, g, h).
