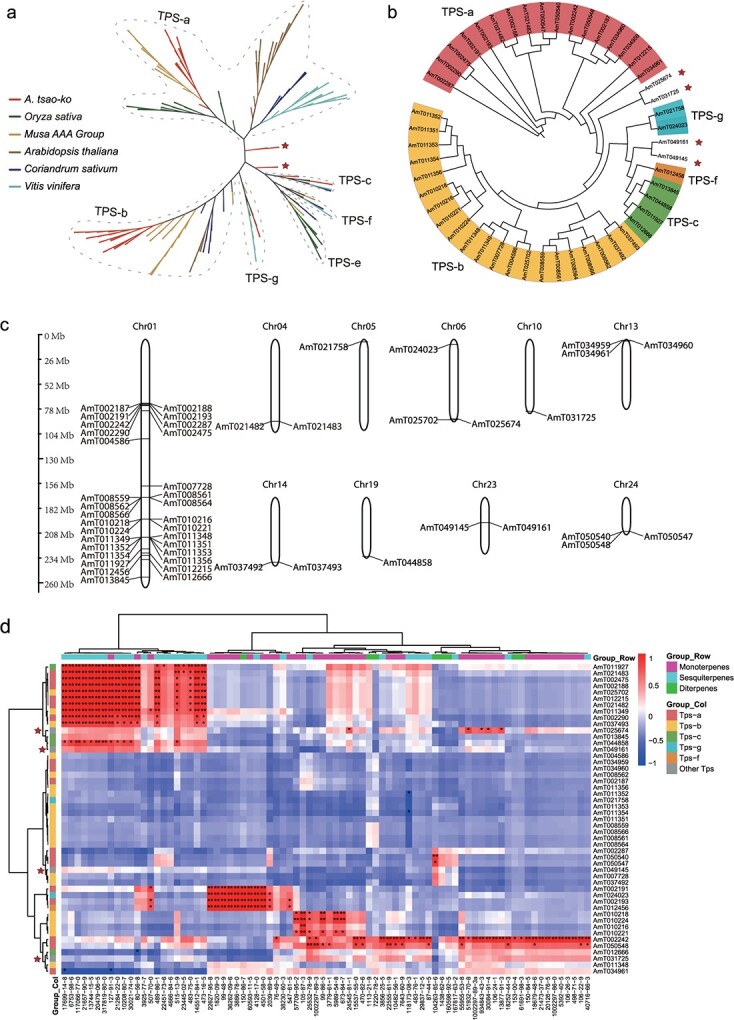
Figure 3.

Metabolic profiling and TPS genes of A. tsao-ko. a Phylogenetic analysis of A. tsao-ko and five representative plant TPS gene families. The representative plants are shown as colored lines; star labels on the phylogenetic tree indicate the expanded genes. b TPS gene clusters detected in A. tsao-ko. c Chromosome distributions of TPS genes. d Correlation heat map of expression patterns of TPS genes and relative content of terpenoids in different organs and stages of ripeness. The compound name is presented by the CAS number from Supplementary Data Table S10.
