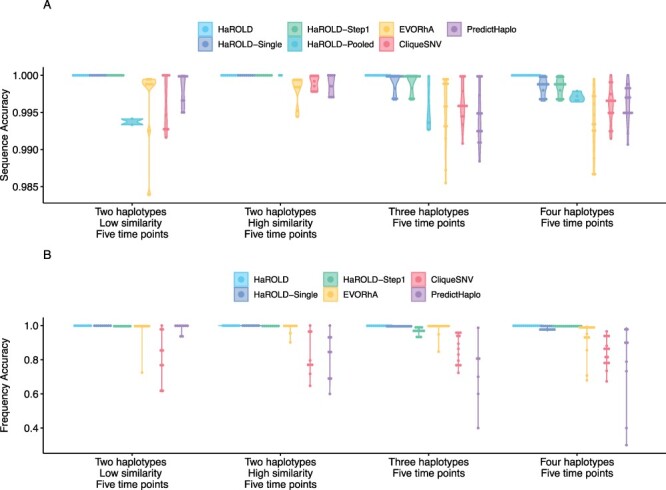
Figure 2.

Violin plots showing the accuracy of haplotype reconstruction in the norovirus test datasets. (A) The accuracy of reconstructed sequences (pairwise identity between the actual sequences and reconstructed sequences). (B) The accuracy of estimated frequencies. Colours indicate different haplotype reconstruction methods. Each dot represents a sequence from each sample.
