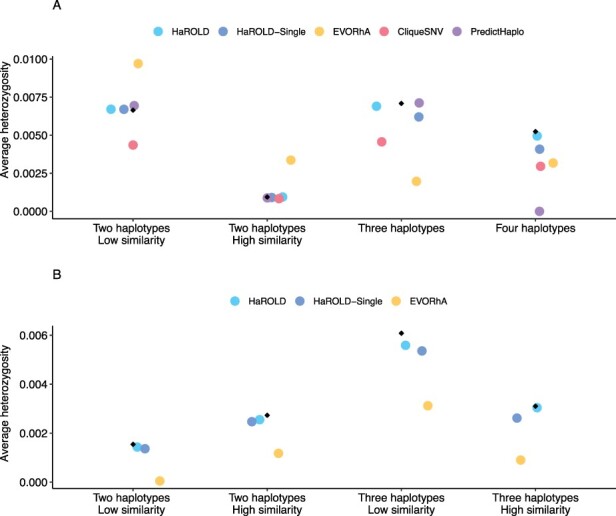
Figure 4.

Accuracy of sample diversity (measured as average heterozygosity) estimations based on reconstructed haplotypes for norovirus dataset (A) and HCMV dataset (B). Average heterozygosity was estimated for one sample for each set for both norovirus (Set1—Sample4, Set2—Sample3, Set3—Sample1, Set4—Sample4) and HCMV (Set1—sample2, Set2—Sample3, Set3—Sample2, Set4—Sample2) True sequence heterozygosity is shown with black diamonds.
