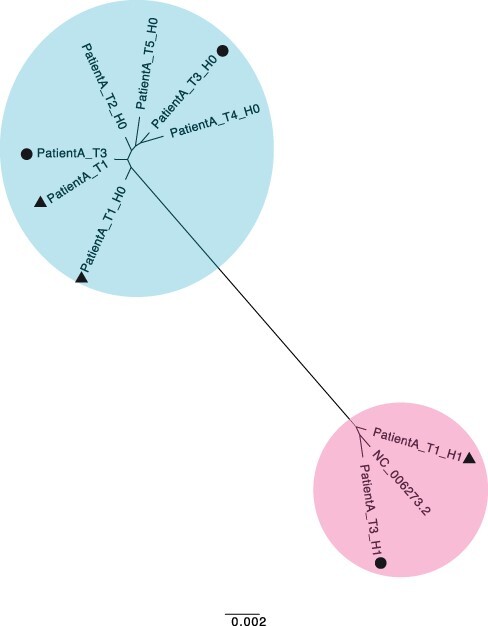
Figure 5.

Maximum likelihood phylogenetic tree of reconstructed haplotypes and consensus sequences for the patient infected with HCMV. Samples of HCMV were taken from PatientA at five time points (T1–T5); reconstructed haplotypes are indicated with H0 and H1. The two haplotypes from the original sample and the consensus sequence from the re-sequenced sample for time point T1 are indicated with a triangle and the corresponding sequences for T3 with a circle. The two viral populations/strains present in the tree are coloured in blue and pink.
