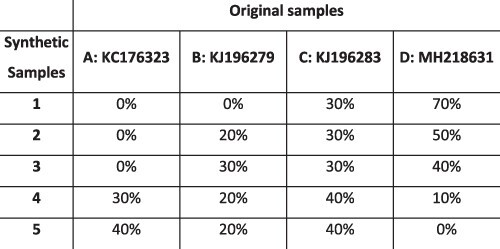
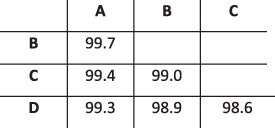
Table 1.
Summary of the longitudinal norovirus synthetic datasets used to test the accuracy of the haplotype reconstruction methods. Four synthetic datasets with five samples each were created for norovirus by mixing GenBank sequences for a total of twenty samples.
| Norovirus | ||
|---|---|---|
| Set | Sample composition | Similarity between haplotypes (percentage identity) |
| Two haplotypes Low similarity Five time points |
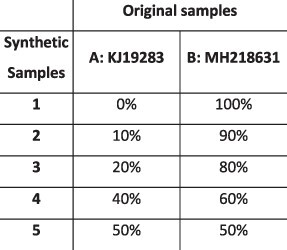
|

|
| Two haplotypes High similarity Five time points |
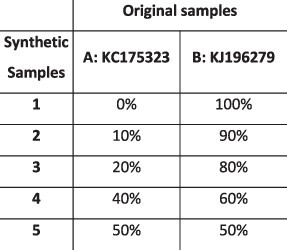
|

|
| Three haplotypes Five time points |
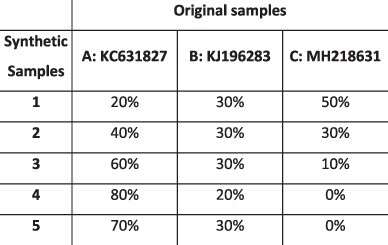
|
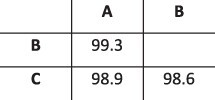
|
| Four haplotypes Five time points |
|
|
