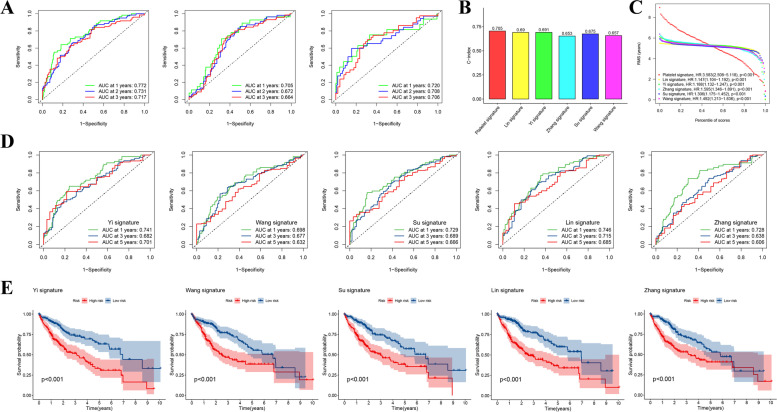
Fig. 6.
Cross-validation of predictive efficiency of the prognostic signature. A ROC curves of HCC patients at 1, 2, and 3 years in the TCGA-LIHC (left), GSE14520 (middle), and ICGC-LIRI (right) cohorts. B C-index of each risk signature: 0.705 for our platelet signature, 0.69 for Lin signature, 0.691 for Yi signature, 0.653 for Zhang signature, 0.675 for Su signature, and 0.657 for Wang signature. C Crosswise comparison of survival differences among distinct risk signatures based on the restricted mean survival (RMS) time: Platelet signature (HR: 3.583, 95%CI: 2.508–5.118, p < 0.001), Lin’s signature (HR: 1.147, 95%CI: 1.014–1.192, p < 0.001), Yi’s signature (HR: 1.188, 95%CI: 1.132–1.247, p < 0.001), Zhang’s signature (HR: 1.595, 95%CI: 1.346–1.891, p < 0.001), Su’s signature (HR: 1.306, 95%CI: 1.175–1.452, p < 0.001), and Wang’s signature (HR: 1.492, 95%CI: 1.213–1.836, p < 0.001). D ROC curves of HCC patients at 1, 3, and 5 years in several other published prediction models. E OS curves of HCC patients stratified by other published risk signatures

