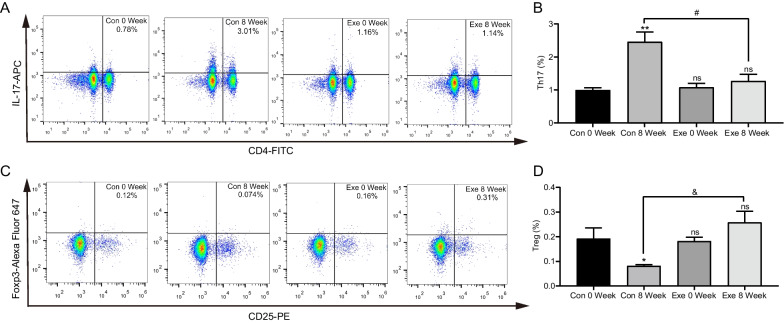
Fig. 2.
Peripheral frequency of Th17/Treg in db/db mice via flow cytometry. A Representative flow cytometric plots of Th17 cells from control (Con) and exenatide (Exe) groups at week 0 and week 8. B Statistical analysis of the percentage of Th17 cells in control and exenatide groups. C Representative flow cytometric plots of Treg cells with CD4-FITC, CD25-PE and Foxp3 staining. D Statistical analysis of the percentage of Treg cells. Data are presented as mean ± SEM; n = 8 in each group; **P < 0.01, *P < 0.05 vs control 0 week; & P < 0.01, # P < 0.05 vs control 8 week; ns P > 0.05

