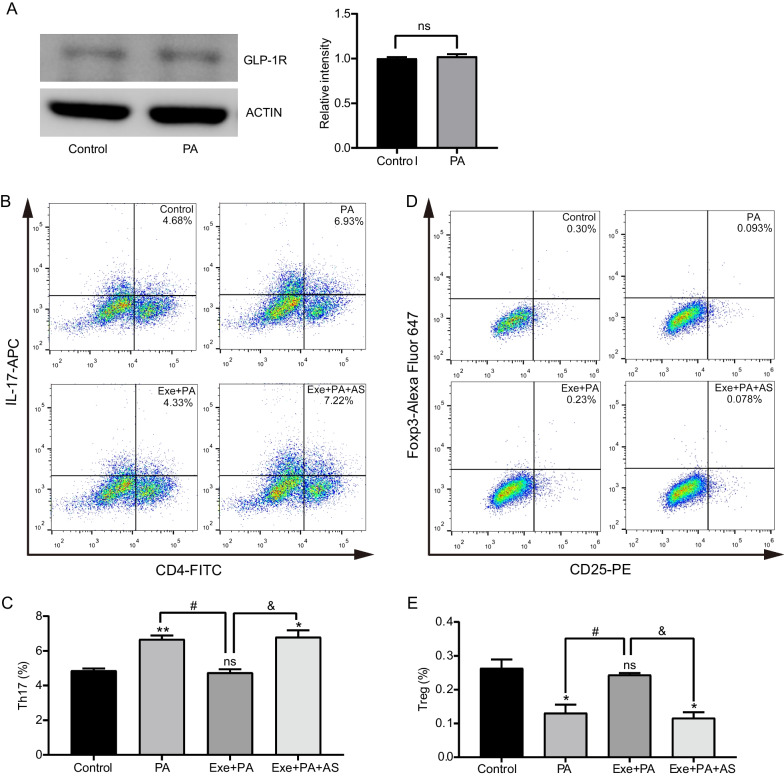
Fig. 4.
Effects of exenatide on Th17/Treg proliferation in vitro. A The expression of GLP-1R in PBMCs from C57BL/6 J mice by western blot. Representative image and gray value analysis of GLP-1R from Control and palmitate (PA) groups. Data are presented as mean ± SEM of three independent experiments. ACTIN was used as a loading control. Naïve CD4 + T cells collected from C57BL/6 J mice were cultured under Th17/Treg-inducing conditions with palmitate (PA), exenatide plus palmitate (Exe + PA) and exenatide, palmitate plus FxoO1 inhibitor AS1842856 (Exe + PA + AS). B Representative flow cytometric plots of Th17 cells from different groups. C Statistical analysis of the percentage of Th17 cells in different groups. D Representative flow cytometric plots of Treg cells with CD4-FITC, CD25-PE and Foxp3 staining. E Statistical analysis of the percentage of Treg cells. Data are presented as mean ± SEM of three independent experiments. **P < 0.01, *P < 0.05 vs control group; #P < 0.05 vs PA group; & P < 0.05 vs Exe + PA group; ns P > 0.05

