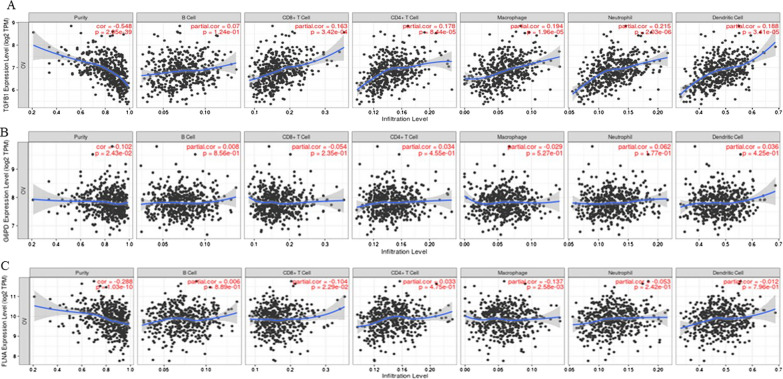
Fig. 11.
Correlation of TGFB1, G6PD, FLNA with infiltration of different subsets of immune cells analysed by TIMER database. The infiltration of B cells, CD8+ T cells, CD4+T cells, macrophages, neutrophils, and dendritic cells in relation to A TGFB1, B G6PD and C FLNA expression was deduced by using TIMER dataset. Statistical significance was evaluated using Spearman’s rho value. The gene expression levels against tumor purity are listed on the top of each scatter plot. Genes highly expressed in the microenvironment are expected to have negative associations with tumor purity, while the opposite is expected for genes highly expressed in the tumor cells

