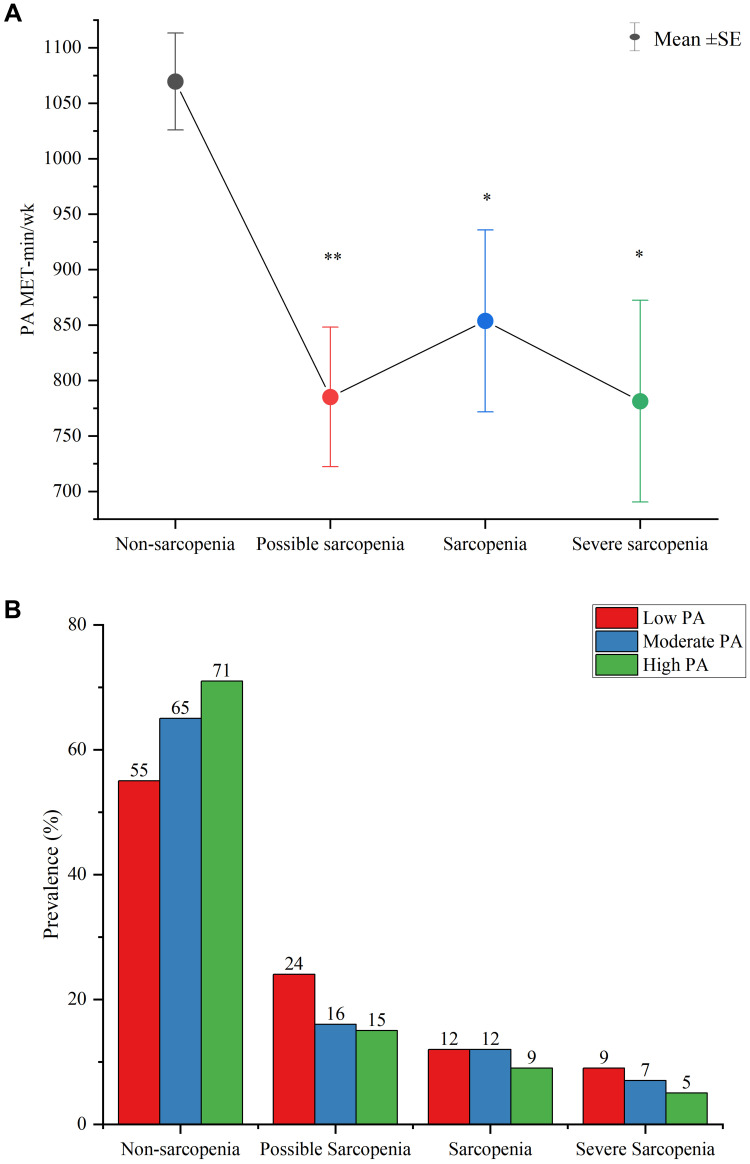
Figure 3.
(A) Mean ± SE for MET-min/wk of physical activity in subjects with non-sarcopenia, possible sarcopenia, sarcopenia, and severe sarcopenia. Statistical comparisons are made with the non-sarcopenia group, *p<0.05, **p<0.01; (B) The sample proportion in low-, moderate-, and high physical activity categories among subjects with non-sarcopenia, possible sarcopenia, sarcopenia, and severe sarcopenia. The numbers at the top of each bar are the sample percentages in each category.

