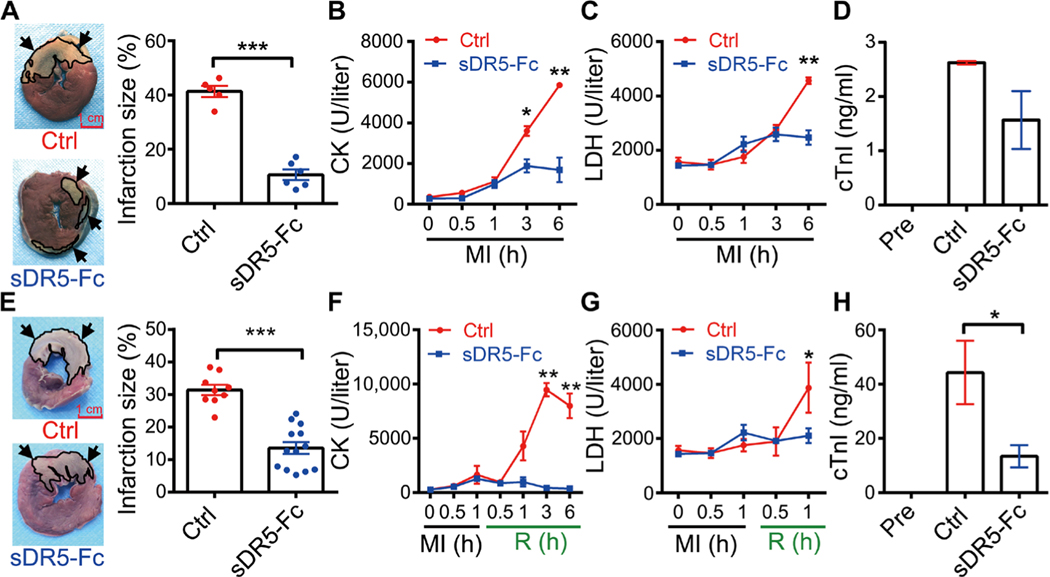
Fig. 2. sDR5-Fc prevents myocardial injury in pigs during AMI and I/R.
(A) TTC-stained heart sections 6 hours after LAD ligation in pigs treated with either PBS (Ctrl; n = 5 pigs) or sDR5-Fc (n = 6 pigs) administered 30 min after LAD ligation. Dead tissue is shown in white (outlined, arrows), whereas viable tissue is shown in red. Quantification of infarct sizes as percentages of the left ventricles is shown in the right panel. (B to D) Plasma concentrations of CK (B), LDH (C), and cTnI (D) at the indicated times (B and C; analyzed by Catalyst Dx Chemistry Analyzer) or 6 hours (D; analyzed by ELISA) after LAD ligation in pigs treated as described in (A). (E) TTC-stained heart sections after I1/R6h in pigs treated with either control PBS (n = 9 pigs, top lef) or sDR5-Fc in PBS (n = 13 pigs, bottom left) administered 5 min before reperfusion. Quantification of infarct sizes as percentages of the left ventricle is shown in the right panel. (F and H) Plasma concentrations of CK (F), LDH (G), and cTnI (H) at the indicated times (F and G; analyzed by Catalyst Dx Chemistry Analyzer) or 6 hours (H; analyzed by ELISA) after reperfusion in pigs treated as described in (E). Quantitative data are shown as means ± SEM. *P ≤ 0.05, **P ≤ 0.01, and ***P ≤ 0.001 as determined by two-tailed t test (A to C and E to G) or one-way ANOVA followed by Tukey’s post hoc test (D and H). Results in each group are pooled from all the pigs used in the group. Scale bar, 1 cm.

