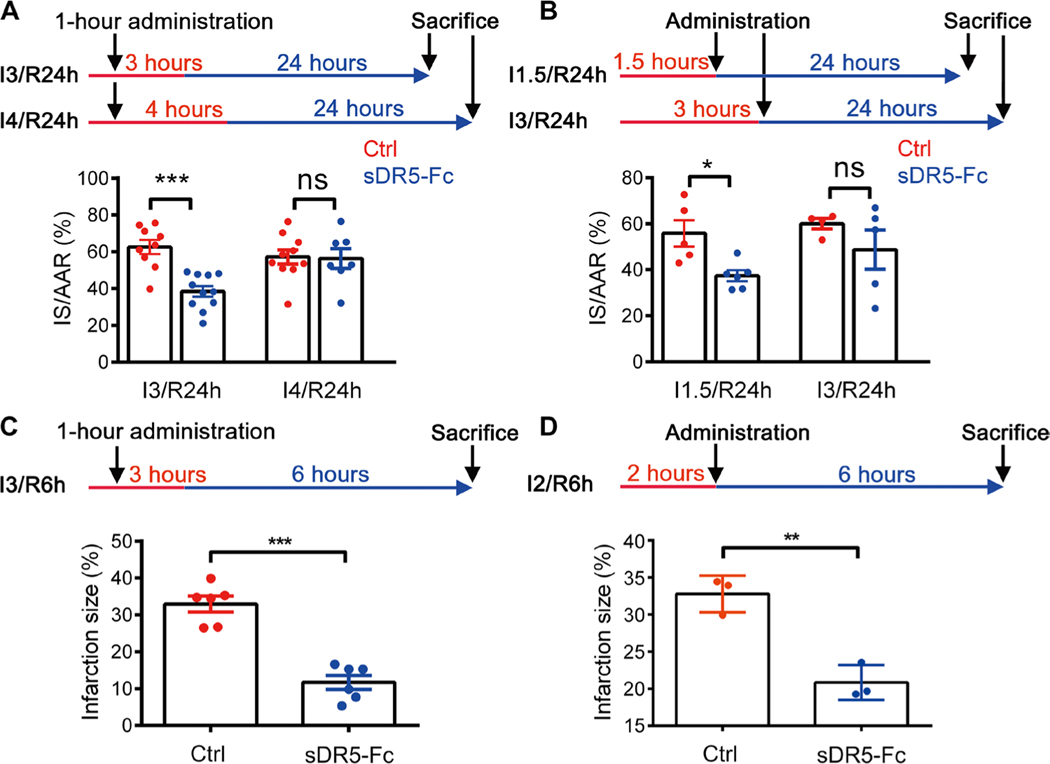
Fig. 4. Timing of therapeutic intervention with sDR5-Fc for cardiac ischemia in rats and monkeys.
(A) Schematic of sDR5-Fc administration 1 hour after ligation in the Wistar rat model. Bottom panel shows quantification of infarct sizes as percentages of IS/AAR in TTC-Evans blue-stained heart sections after I3/R24h and I4/R24h in rats treated with either PBS (n = 9 in I3/R24h model and n = 10 in I4/R24h model) or sDR5-Fc in PBS (n = 11 in I3/R24h model and n = 7 in I4/R24h model) administered 1 hour after ligation. (B) Schematic of sDR5-Fc administration 1.5 or 3 hours after ligation in the Wistar rat model. Bottom panel shows quantification of infarct sizes as percentages of IS/AAR of TTC-Evans blue-stained heart sections after I1.5/R24h and I3/R24h in rats treated with either PBS (n = 5 in I1.5/R24h model and n = 4 in I3/R24h model) or sDR5-Fc in PBS (n = 6 in I1.5/R24h model and n = 5 in I3/R24h model) administered 5 min before reperfusion. (C) Schematic of sDR5-Fc administration 1 hour after ligation in rhesus macaques. Bottom panel shows quantification of infarct sizes as percentages of the left ventricle of TTC-stained heart sections after 3-hour ischemia and 6-hour reperfusion (I3/R6h) in rhesus macaques treated with either PBS (n = 6 monkeys) or sDR5-Fc in PBS (n = 6 monkeys) administered 1 hour after ligation. (D) Schematic of sDR5-Fc administration 2 hours after ligation in rhesus macaques. Bottom panel shows quantification of infarct sizes as percentages of the left ventricle of TTC-stained heart sections after 2-hour ischemia and 6-hour reperfusion (I2/R6h) in rhesus macaques treated with either PBS (n = 3 monkeys) or sDR5-Fc in PBS (n = 3 monkeys) administered 5 min before reperfusion. Each data point represents one animal. Red line represents ischemic time, and blue line represents reperfusion time. Quantitative data are shown as means ± SEM. *P ≤ 0.05, **P ≤ 0.01, and ***P ≤ 0.001 as determined by two-tailed t test. Data for rats are representative of three independent experiments (A and B), and data for monkeys are pooled from all animals used (C and D).

