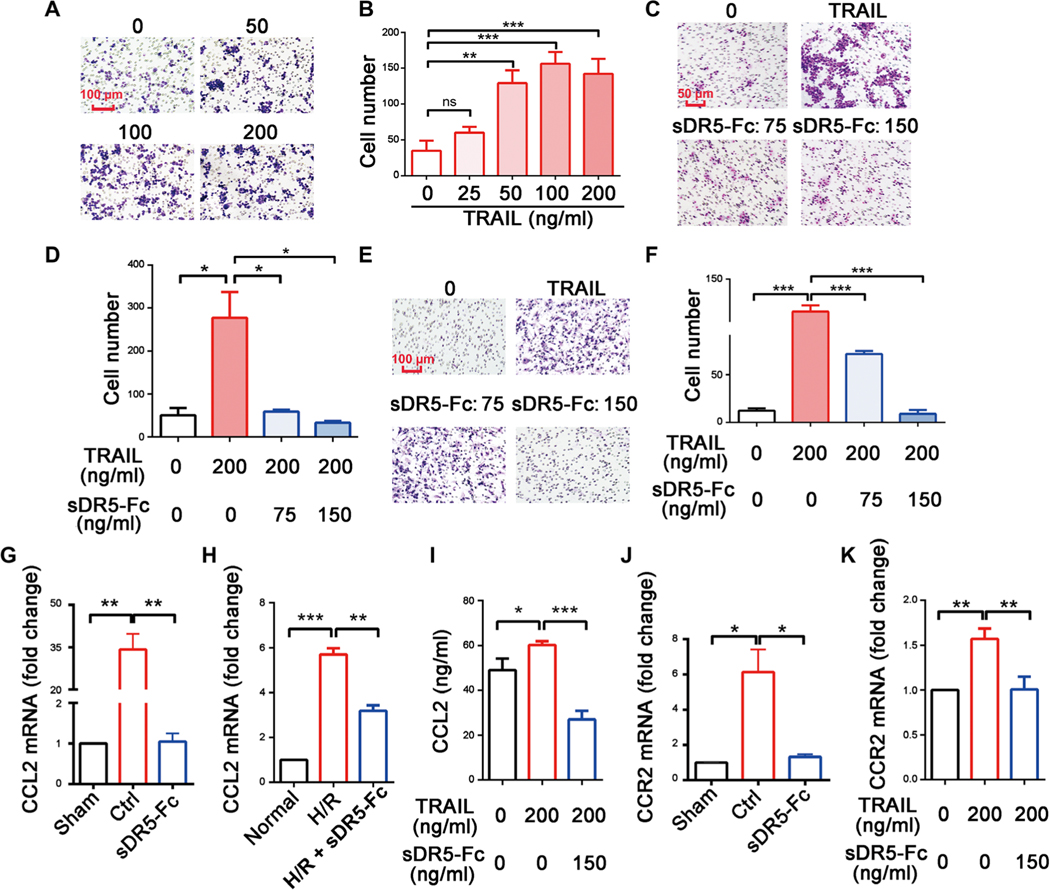
Fig. 7. TRAIL is a chemoattractant for myeloid cells.
(A and B) Representative images of migrating NR8383 cells in response to the indicated concentrations of TRAIL in a Transwell assay (A) and the quantification of the results (B). Scale bar, 100 μm. (C and D) Representative images of migrating NR8383 cells in the presence of the indicated concentrations of TRAIL or sDR5-Fc in a Transwell assay (C) and the quantification of the results (D). Scale bar, 50 μm. (E and F) Representative images of migrating rat BMDMs in the presence of the indicated concentrations of TRAIL or sDR5-Fc in a Transwell assay (E) and the quantification of the results (F). Scale bar, 100 μm. (G and H) The expression of CCL2 mRNA in the left ventricles of rat hearts after I1/R24h (G; sDR5-Fc was administered 5 min before reperfusion) and in NR8383 cells treated with hypoxia/reoxygenation (H/R) and/or sDR5-Fc (H; sDR5-Fc was present during both hypoxia and reoxygenation). (I) The concentrations of CCL2 protein in the supernatant of BMDMs treated with TRAIL and/or sDR5-Fc as determined by ELISA. (J and K) The expressions of CCR2 mRNA in the left ventricles of rat hearts after I1/R24h (J; sDR5-Fc was administered 5 min before reperfusion) and in NR8383 cells (K; sDR5-Fc was present during both hypoxia and reoxygenation) treated with TRAIL and/or sDR5-Fc. Data are shown as means ± SEM.*P ≤ 0.05, **P ≤ 0.01, and ***P ≤ 0.001 as determined by one-way ANOVA followed by Tukey’s post hoc test. The experiments were repeated at least three times with similar results.

