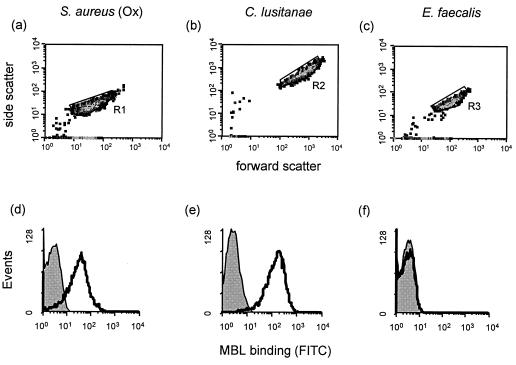
FIG. 1.
Representative population density plots of three organisms (S. aureus NCTC6571, C. lusitanae, and E. faecalis) detected by a combination of forward scatter and side scatter and gated as regions R1, R2, and R3, respectively (a to c). The corresponding flow cytometric profiles of MBL binding to these organisms using the protein at a final concentration of 5 μg/ml are shown (d to f). The control profiles (shaded) show organisms incubated with FITC-conjugated anti-MBL alone. Experimental samples (open profiles) were obtained after incubation of organisms with MBL and FITC-conjugated anti-MBL.

