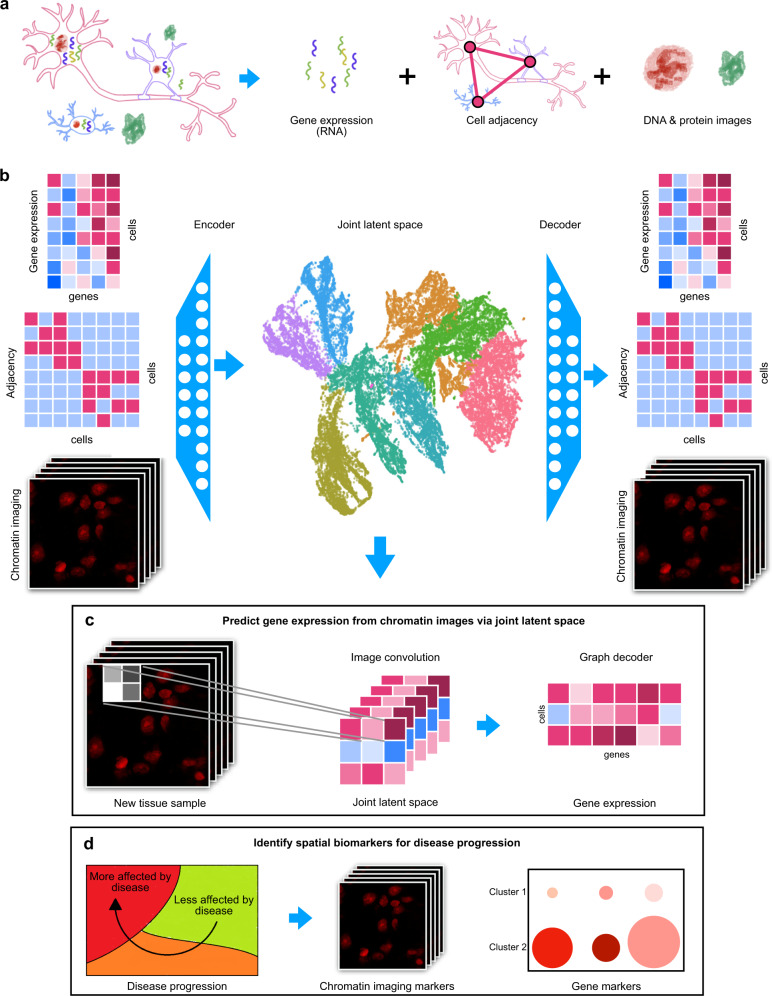
Fig. 1. STACI learns a joint representation of gene expression, cell adjacency, and chromatin images.
a STARmap PLUS jointly measures gene expression, chromatin condensation, and protein accumulation in whole tissue sections. Cell adjacencies are determined based on the location of the cell nuclei. b A joint latent space is computed for gene expression, cell adjacency, and chromatin images using an autoencoder neural network architecture. Separate decoders are used to reconstruct the three modalities from the joint latent space. UMAP is used to visualize the joint latent representation of all cells in the tissue samples; the cells are colored by cluster membership, with clustering performed in the joint latent space. c When a new tissue sample with only chromatin imaging is obtained, then the joint latent representation of this new sample can be inferred through the image encoder. Gene expression profiles of the new sample at single-cell resolution can be predicted from the joint latent representation using the trained gene expression decoder. d The joint latent space can be used to analyze the spatio-temporal progression of disease in a holistic manner using all available data modalities and to identify disease biomarkers including disease-associated changes in gene expression, cellular neighborhoods, nuclear morphology, and chromatin condensation.

