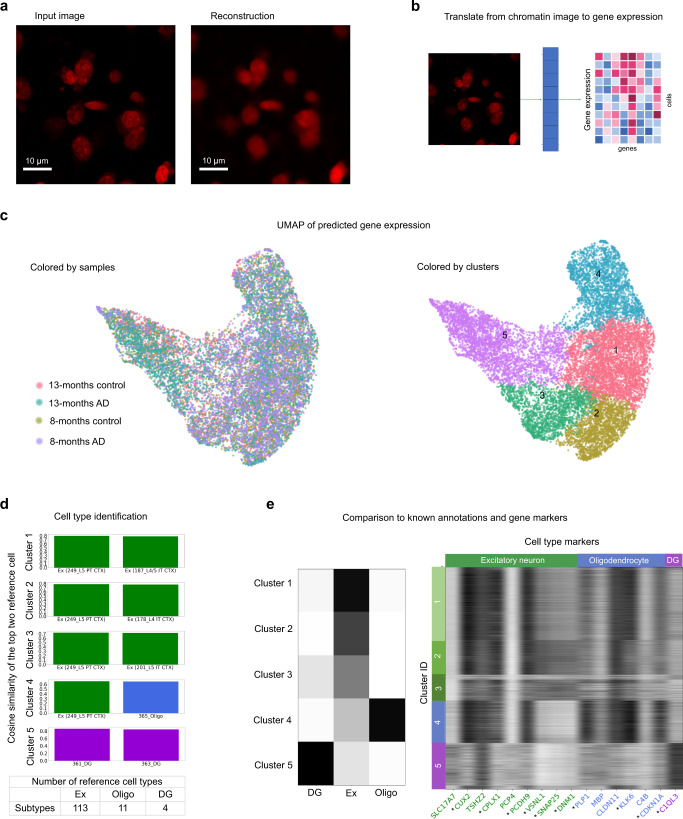
Fig. 3. STACI translates chromatin images to gene expression profiles through the learned joint latent space.
The 8-months control sample was not used in training the graph or image autoencoders. a An example of the reconstruction of a chromatin image in the 8-months control sample using the image autoencoder. Similar reconstruction quality of chromatin images is observed across the 8-months control sample with 8062 cells. b Schematic of translating chromatin images to gene expression. The joint latent space embedding is inferred from the chromatin images by the image encoder. Single-cell gene expression profiles are predicted from the inferred joint latent space by the gene expression decoder. c UMAP of the predicted gene expression profiles. The predicted single-cell gene expression profiles of the test sample (8-months control) falls within the variation of the training samples (left). Leiden clustering applied to the predicted gene expression profiles identifies five clusters (right). d Bar plot of average cosine similarity between cells in each of the five clusters and the mean expression of the top two cell types in a reference atlas53 (ranked by average cosine similarity). The lower table shows the number of reference cell types in the atlas corresponding to excitatory neurons (Ex), oligodendrocytes (Oligo), and dentate gyrus (DG). e Cell type composition in each cluster in the 8-months control sample as annotated in Zeng et al.4 (left) is consistent with the predicted cell type annotations in (d). Predicted expression of known cell type markers in each cluster in the 8-months control sample excluded from training (right) show cell type specificity. *Differentially expressed cluster markers for each cell type; p-val < 0.05 and fold change > 1.1. Excitatory neurons (excluding CA1, CA2, CA3), DG, and oligodendrocytes in the corpus callosum are included in the clustering to represent major neuronal and glial cell types. All samples were used for clustering and differential expression analysis.

