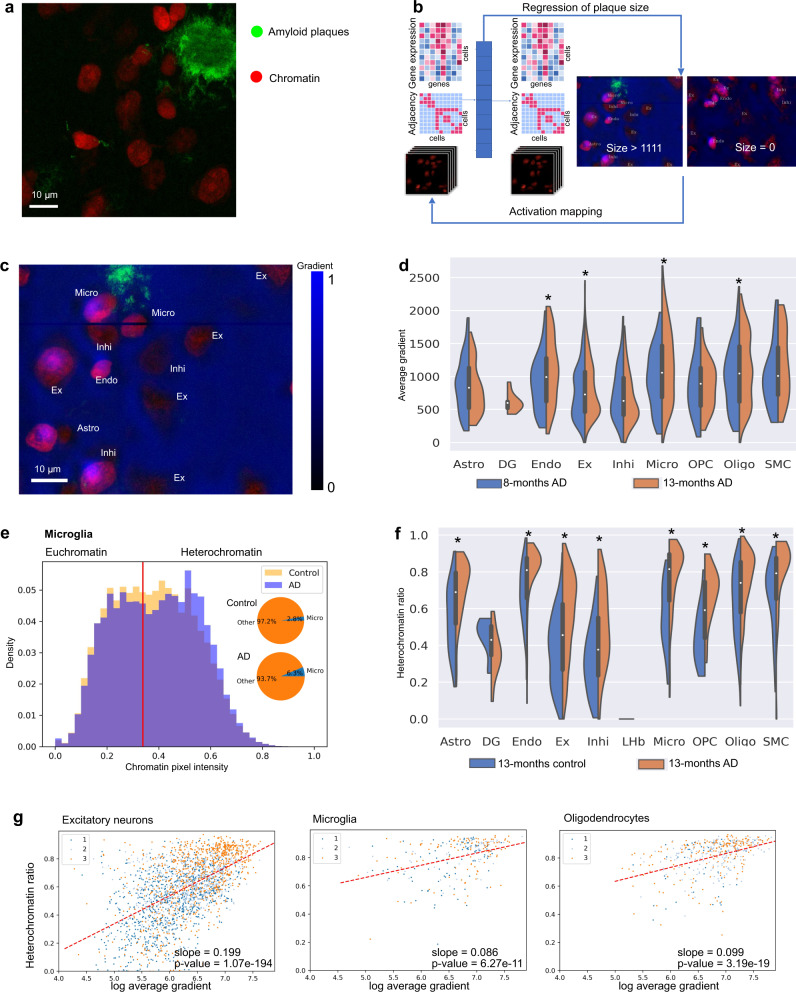
Fig. 4. Prediction of amyloid plaque size from the joint latent representation results in the identification of cell types and chromatin features that are predictive of plaque near cells.
a An example of overlaid chromatin (red) and amyloid plaque (green) channels from the 13-months AD sample with 10021 cells. b Schematic of our regression model that predicts plaque size from the joint latent representation of gene expression, cell adjacencies, and chromatin images. c Regression gradient (blue) projected to the input chromatin image (red). The analysis uses the two AD mouse samples with at least 7257 cells each. d Distribution of regression gradients within single cells in each cell type in cluster 3 of AD samples. *p-value < 0.05 for 8-month vs 13-month samples. Cells are from two mice with at least 7257 cells each. Bounds of boxes indicate quartiles. Whiskers indicate extrema. Two-sided T-tests are performed and raw p-values are 0.2446 (Astro), 0.002677 (Endo), 0.04300 (Ex), 0.2872 (Inhi), 0.002549 (Micro), 0.6968 (OPC), 0.01780 (Oligo), 0.1019 (SMC). e Histogram of chromatin pixel intensities of microglia in the cortex of the 8-months samples (normalized to sum to 1, since the proportion of microglia increases in AD; see inset). Red line: threshold of heterochromatin pixels (see Methods). f Distribution of heterochromatin ratio of each cell type in cluster 3 of 13-months control and AD samples. *p-value < 0.05 for control vs AD samples. Cells are from two mice with at least 7766 cells each. Bounds of boxes indicate quartiles. Whiskers indicate extrema. Two-sided T-tests are performed and raw p-values are 8.715e−9 (Astro), 0.07304 (DG), 2.705e−8 (Endo), 1.380e−41 (Ex), 9.950e−8 (Inhi), 6.053e−8 (Micro), 1.111e−4 (OPC), 4.544e−13 (Oligo), 9.479e−4 (SMC). g Heterochromatin ratio versus log2 average gradient of cells in the cortex of the 8-months AD sample colored by cortex cluster membership. Red line fitted using linear regression. P-values are calculated by two-sided Wald Test and the null hypothesis that the slope is 0. Ex excitatory neuron, Micro microglia, Inhi inhibitory neuron, Endo endothelial cell, Astro astrocytes, OPC oligodendrocyte precursor cell, SMC smooth muscle cell.

