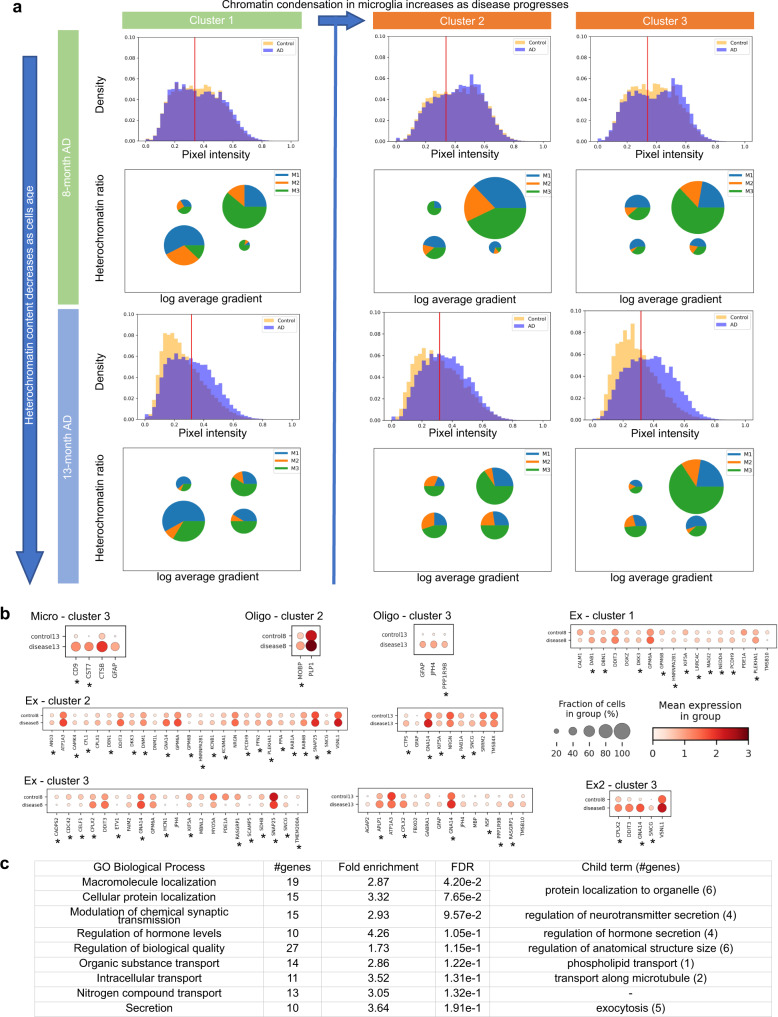
Fig. 5. Chromatin condensation is indicative of the impact of amyloid plaques on cells.
a Chromatin intensity, heterochromatin ratio, and regression gradient of plaque size in microglia. The known disease-associated subtype of microglia (DAM, M3) has high heterochromatin ratio and high regression gradient, whereas the other subtypes dominate the lower left quadrant with low heterochromatin ratio and low gradient. Histograms: chromatin pixel intensities of all microglia in the three cortex clusters at each time point, normalized to sum to 1 (see Methods). Red line: threshold for identifying heterochromatin pixels (see Methods). Pie charts: microglia grouped into four quadrants by heterochromatin ratio (threshold at 0.8) and log average gradient (threshold at 6.7). Size of a pie chart is proportional to the fraction of cells in the respective quadrant. Angles in a pie chart are proportional to the fraction of each cell subtype in the respective quadrant. b Using regression gradient and heterochromatin ratio to obtain more powerful and specific transcriptomic markers of disease. Differential expression analysis of cells with high gradient and high heterochromatin ratio (top right quadrant) in the AD samples compared to cells with low gradient and low heterochromatin ratio (lower left quadrant) in the control samples at the same time points. The threshold of differential expression using Wilcoxon rank-sum test79 is p-value <0.05 after adjustment by Benjamini-Hochberg procedure73 and fold change of at least 10% in either direction. At most 25 upregulated and 25 downregulated genes with the smallest p-values are shown. *Genes not found in the standard DE analysis between cells close to and far away from plaques (see Supplementary Fig. 19). The exact p-values and log fold changes of all differentially expressed genes are provided in Source Data 1. c Gene ontology enrichment analysis of upregulated differentially expressed genes in excitatory neurons in cortex cluster 2 of the 8-months AD sample are related to synaptic transmission, secretion, protein localization, and transport, which have known associations with AD. The background of the enrichment analysis consists of all genes in the STARmap PLUS dataset.

