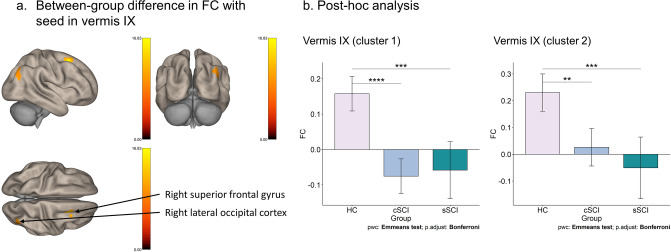
Figure 1.
Functional connectivity group differences in the vermis. (a) The significant group differences of the functional connectivity (FC) in vermis IX between HC, cSCI and sSCI are shown (pFDR < 0.05). (b) Estimated marginal mean (Emmean) FC is shown on the y-axis for the different groups on the x-axis for cluster 1 (right superior frontal gyrus) and cluster 2 (right lateral occipital cortex). All comparisons are Bonferroni corrected. Cluster 1: HC (Emmean = 0.16; Standard Error (SE) = 0.02); cSCI (Emmean = − 0.08; SE = 0.02); sSCI (Emmean = − 0.06; SE = 0.04). Cluster 2: HC (Emmean = 0.23; SE = 0.03); cSCI (Emmean = 0.03; SE = 0.03); sSCI (Emmean = − 0.05, SE = 0.06). **p < 0.01, ***p < 0.001, ****p < 0.0001.

