Fig. 7.
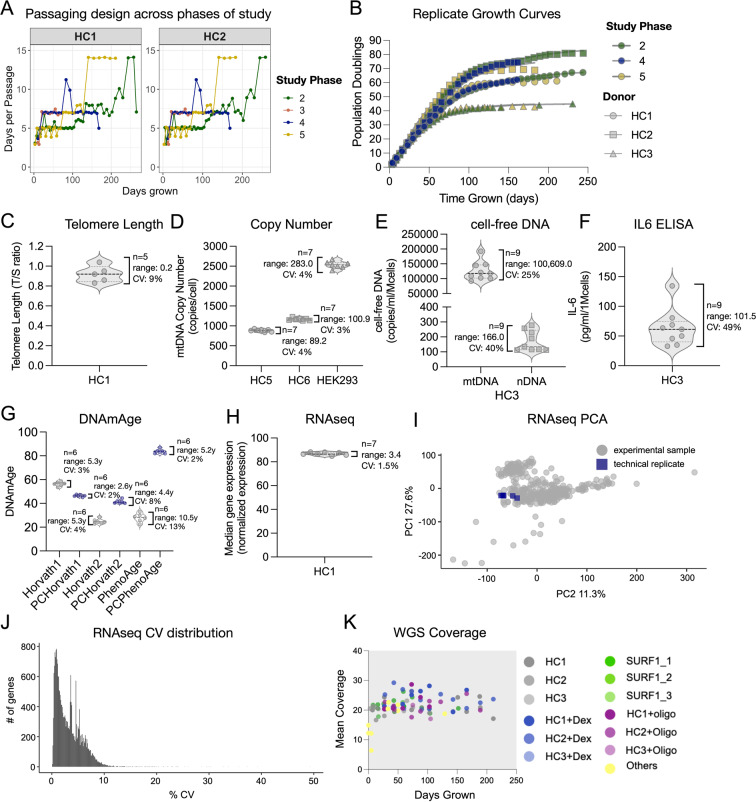
Experimental replication and technical variation across multi-modal measurements. (A) Timecourse of the number of days between each passage for each phase of the study. (B) Growth curves of donors repeated at different phases of the study. Color indicates phase of study and shape indicates cell line donor. (C–H) Variation in technical replicates for (C) telomere length, (D) mtDNA copy number, (E) cell-free DNA, (F) IL6 as measured by ELISA, (G) DNAmAge as estimated by three epigenetic clocks and there PC-adjusted calibrations, and (H) average RNAseq-based transcript levels across all expressed genes. (I) Principal component analysis of all expressed genes for the full 354 sample RNAseq dataset. Technical replicates are highlighted in blue (n = 7). (J) Coefficient of variations in transcript per million (TPM) across the 7 RNAseq technical replicates for each mapped gene. The majority of genes have CVs <5%, and 99% of genes have CVs <10%. (K) Mean sequencing coverage for whole genome sequencing (n = 94 samples).

