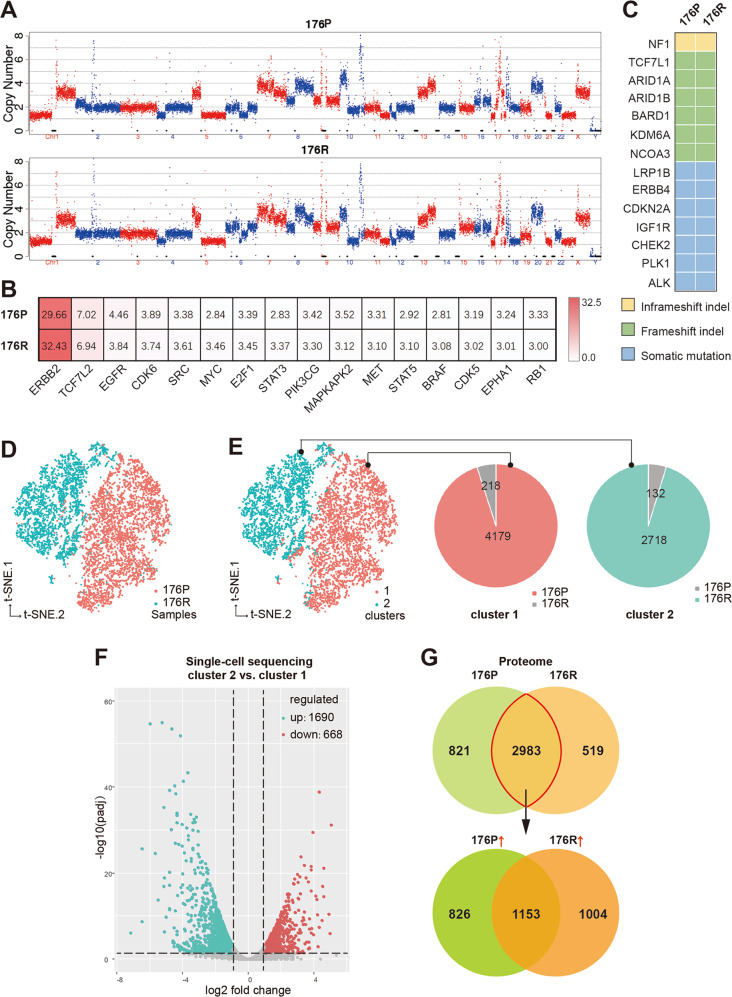
Fig. 2. Gene expressional changes, rather than genomic variations, contributed to acquired Trastuzumab resistance.
A The full view of whole chromosomal copy number in 176P and 176R tissues by whole-genome sequencing (WGS). B The copy number of some cancer-related genes in 176P and 176R tissues. C The mutation profiles of cancer-related genes were consistent in 176P and 176R tissues. D Cells derived from 176P and 176R tissues were well divided into two groups after t-SNE algorithm analysis by single-cell RNA sequencing. E According to the k-means clustering algorithm, all the cells were divided into two separated subgroups when k = 2. Cells derived from 176P and 176R tissues were dominant in cluster 1 (pink) and cluster 2 (green), respectively. F Volcano plot displayed differentially expressed molecules of cluster 1 and cluster 2 when fold change ≥2. G Venn diagram showed differentially expressed molecules in 176P and 176R tissues detected by protein mass spectrometry. A total of 2983 molecules expressed both in 176P and 176R tissues, among which 1004 molecules were upregulated after acquired Trastuzumab resistance when fold change ≥ 1.5.

